
Democratising ESG scores for EU companies.
Democratising ESG scores for EU companies.
Launching a centralised platform of ESG scores for EU companies.
Launched a one-stop web-platform for Financial Analysts to collect ESG scores of companies and companies to their ESG scores with ease.
Launched a one-stop web-platform for Financial Analysts to collect ESG scores of companies and companies to their ESG scores with ease.
Overview
Led the UX design of a web-based platform that centralises ESG (Environmental, Social, and Governance) data from EU companies. The project focused on enabling accurate data uploads and building a robust discovery experience tailored to financial analysts and sustainability leaders. Through iterative prototyping, service blueprinting, and co-creation sessions, we launched a product that balanced transparency, usability, and data quality.
My role
• Led UX design across the full product lifecycle—from research and ideation to delivery
• Conducted qualitative research with ESG data providers and analysts to surface pain points
• Facilitated co-creation and service blueprinting workshops with internal stakeholders
• Designed modular interfaces for complex data upload and discovery workflows
• Developed and maintained a scalable design system for consistent delivery
• Collaborated closely with engineers and compliance to ensure implementation quality
Team:
• Business Analyst
• Ser vice Designer
• Developers
• Client
Timeline:
1.5 yrs
My role:
Lead UX Designer
Problems
EU companies are under increasing pressure to track and report ESG metrics. However, data uploads are inconsistent, and discovery interfaces are not tailored to the differing needs of users.
1. Complex, error-prone data input (data upload) from analysts
2. Lack of ownership and traceability in datasets
3. Display of data needs contextual information and categorisation (data view)
4. No consistent user experience for discovering and comparing ESG scores

Goals
Create a unified ESG data platform that bridges the gap between financial analysts seeking reliable ESG scores and companies needing to track and improve their sustainability performance.
For Financial Analysts
1. Access standardized ESG scores across multiple data providers
2. Reduce time spent reconciling different scoring methodologies
3. Enable faster, more confident investment decisions
For Companies
1. Monitor their ESG performance across different rating agencies
2. Identify specific areas for ESG improvement
3. Streamline ESG data collection and reporting processes
Part 1
Part 1
1. Uploading Data
Uploading complex datapoints goes through many challenges and to understand them better, I conducted a qualitative research by interviewing Data Analysts and Data Compliance Managers

Screenshot of the research plan that I made with another designer.
Key insights from research
Low-error data input
Data entering mistakes also happen with trained analysts who are monetarily incentivised.
Automation & Guidance
Automation & Guidance
Data is unstructured and evolving and automation can help in structuring but high-quality data is always a human decision.
Authoring
Data providers identity should be protected for removing company’s influence.
Data providers identity should be protected for removing company’s influence.
How might we enable a process for clean data upload?
How might we enable a process for clean data upload?
Task flow to understand Data Upload process

Task flow for data upload process. Green highlights indicate unknown information where we made assumptions to move forward.
Assumptions were made to move forward as we didn't have all the answers in the data collection/upload taskflow.
1. The money generation for data provider will be based on the number of datasets they provide.
2. The status of the dataset should be present so that they can track the progress with their dataset portfolio.
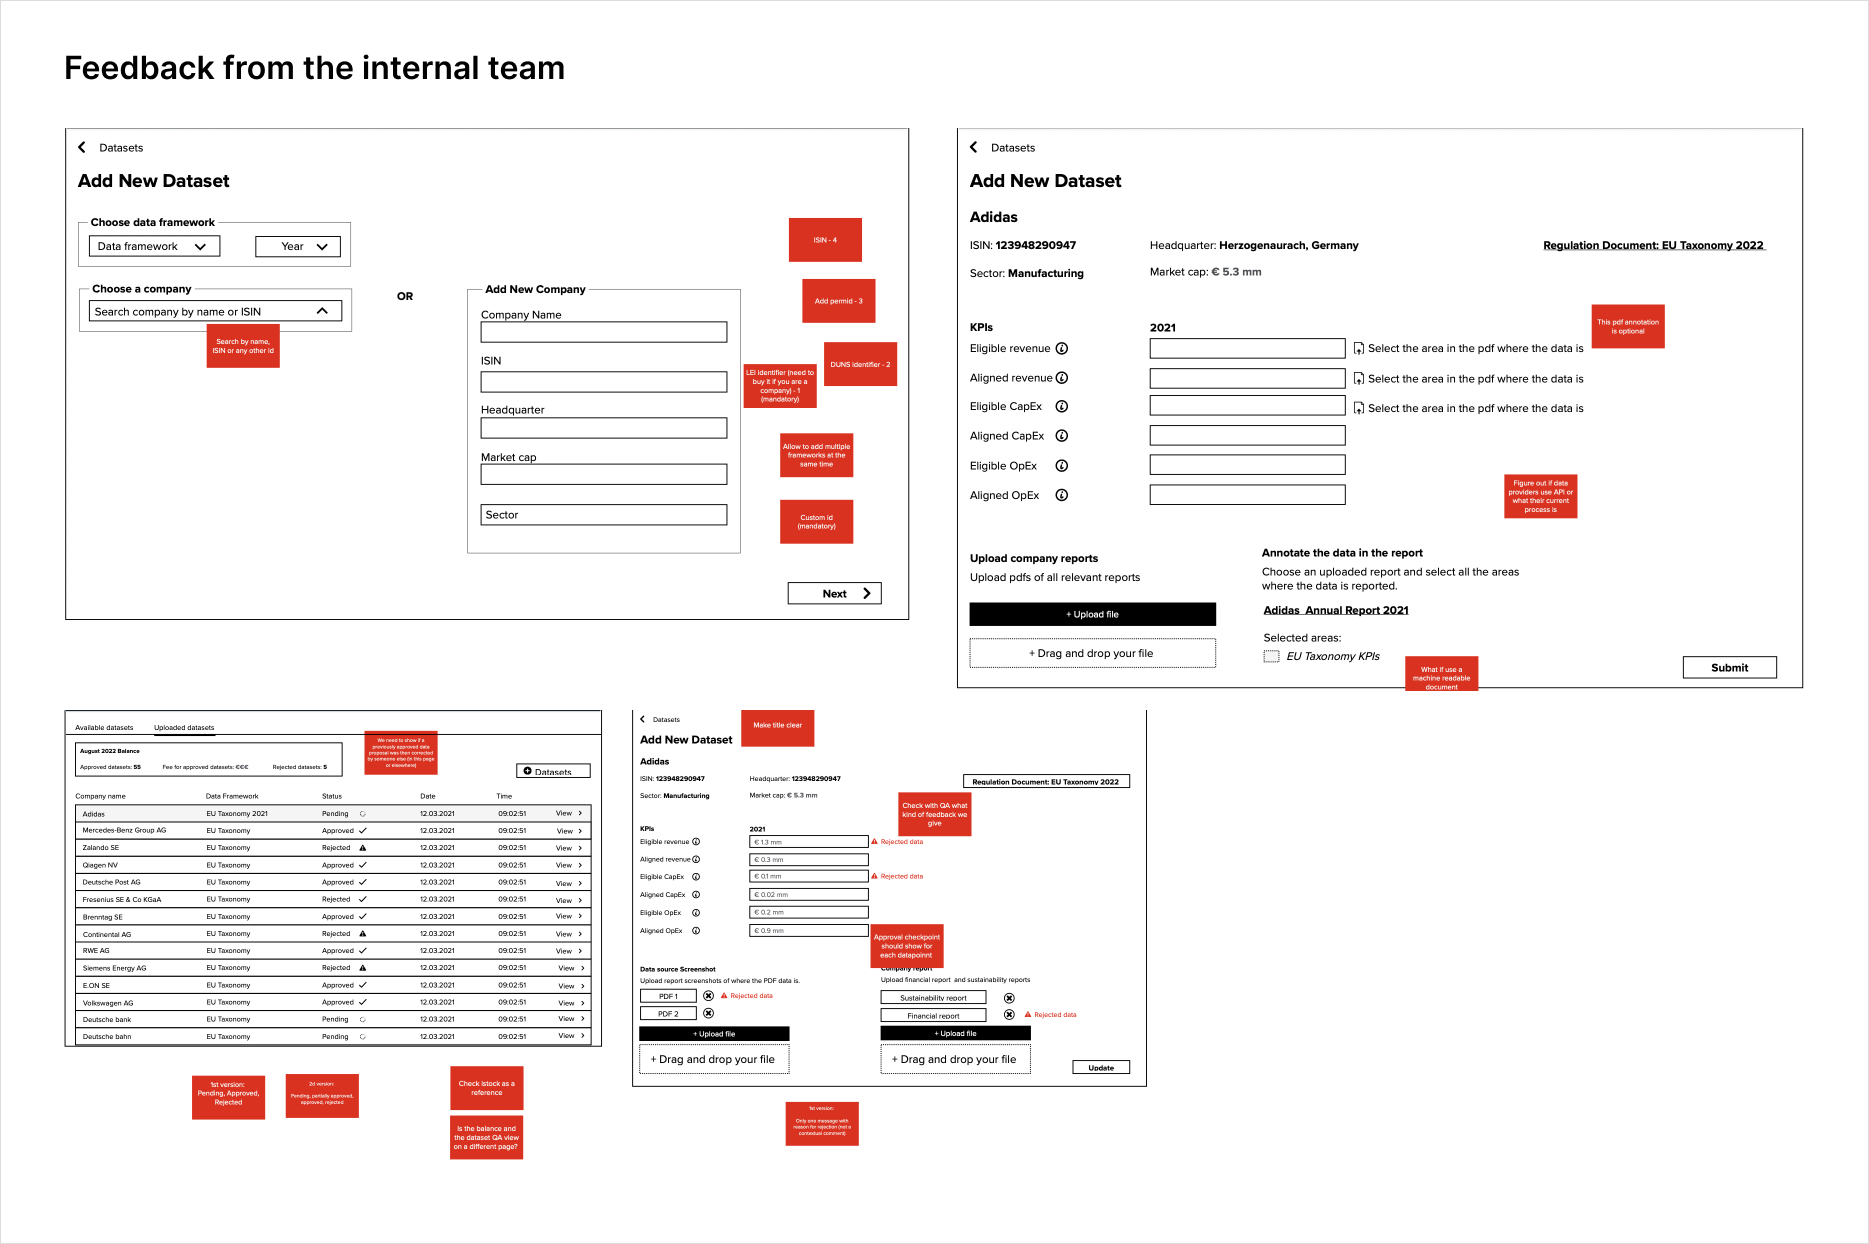
Filled form with all the approval of datasets

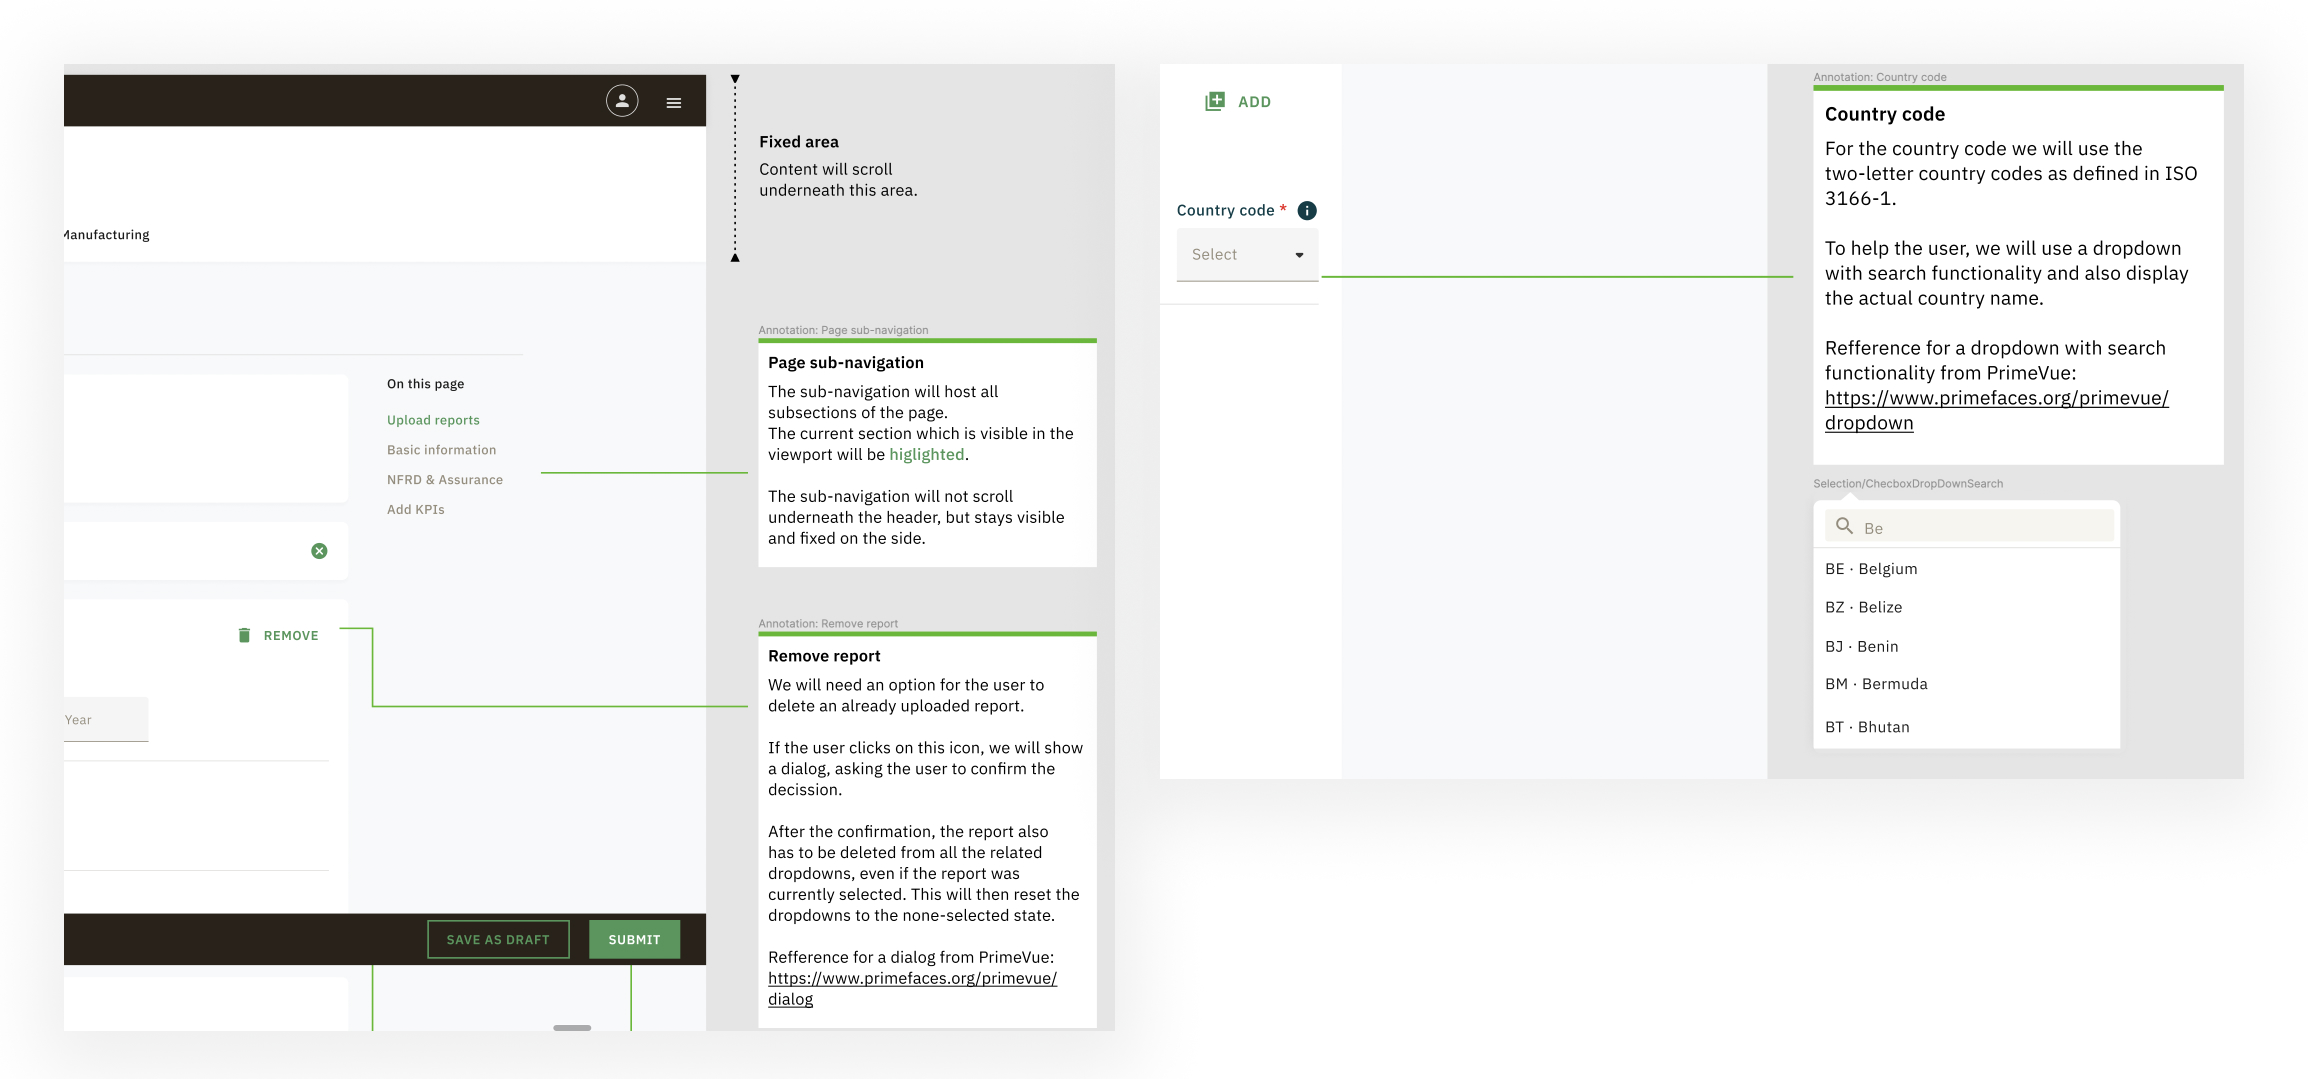
Empty form showing the details and annotations

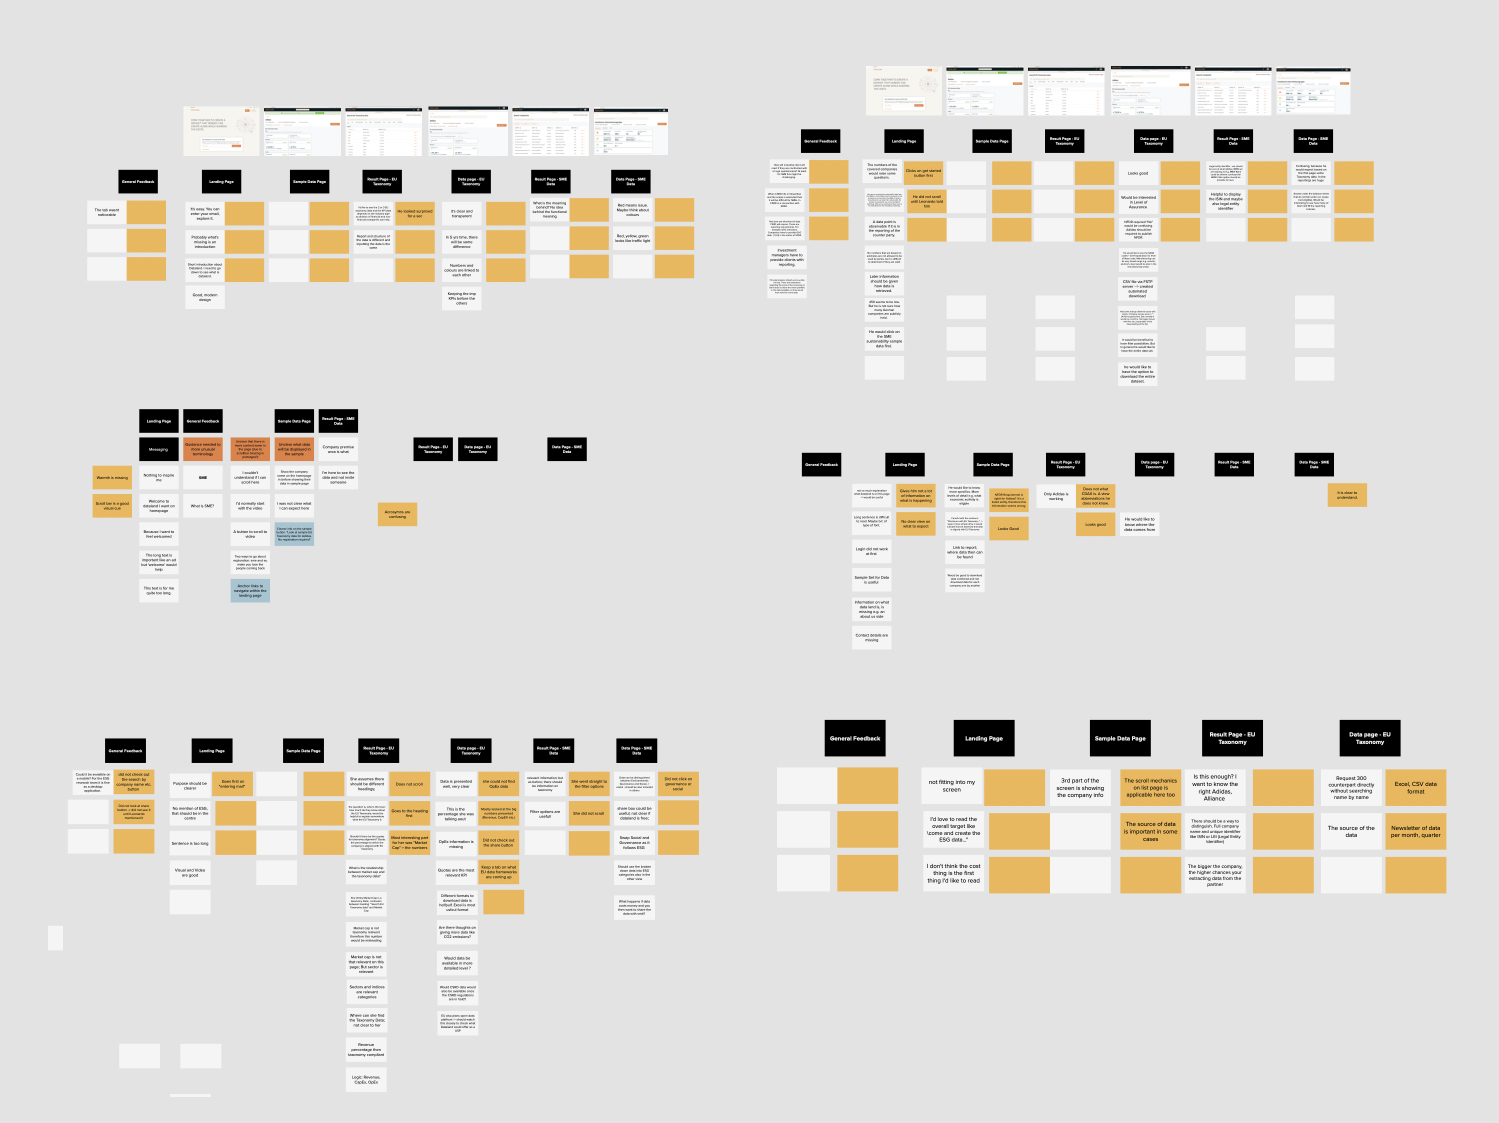
The low-fi prototypes were used to bring internal stakeholders onboard with the concepts and raise conerns if they see any.
1. They fine-tuned the missing information
2. They helped us add features like PDF download and error handling
Co-creation session with data uploaders/owners revealed the followings:
1. Quality check criteria should be in place
2. Data provider reputation depends on data upload quality
3. Automated check for data like location and history should be put in place
A page from data upload process.
Part 2
Part 2
2. Displaying Data
The table in XML files are complicated and they need to be presented in a simpler manner which can be scanned but should also be presented in depth if need be.

Screenshot of an excel table which needed to be displayed for better comprehension.
Building from the scratch
The project was starting from a whiteboard and I with another designer charted out a service blueprint of the envision product with internal stakeholders during multiple sessions. This led to the following:
1. A shared understanding of the project
2. Parts where design, developement and compliance play crucial roles
3. Helped prioritise what we can deal faster and what are the potential blockers in the future

The service blueprint helped us with the points mentioned above.
Key finding
We identified that user persona like Financial Analysts can like to search for the company data (expert user) and another persona like Sustainability Leaders (novice user) prefer glancing through companies data for comparison and overview.
Concept
Using a metaphor of layers, the concept revolves around presenting data as much as the user needs it. The two personas a) Financial Analysts who like to have deeper understanding of the companies b) Sustainability Leaders who like to monitor their competitors on a surface level.
Search as ‘Layer 1’
Robust search with company listings for quick access by name or identifier.

A search bar for users to quickly get to the company they want to know the data of.
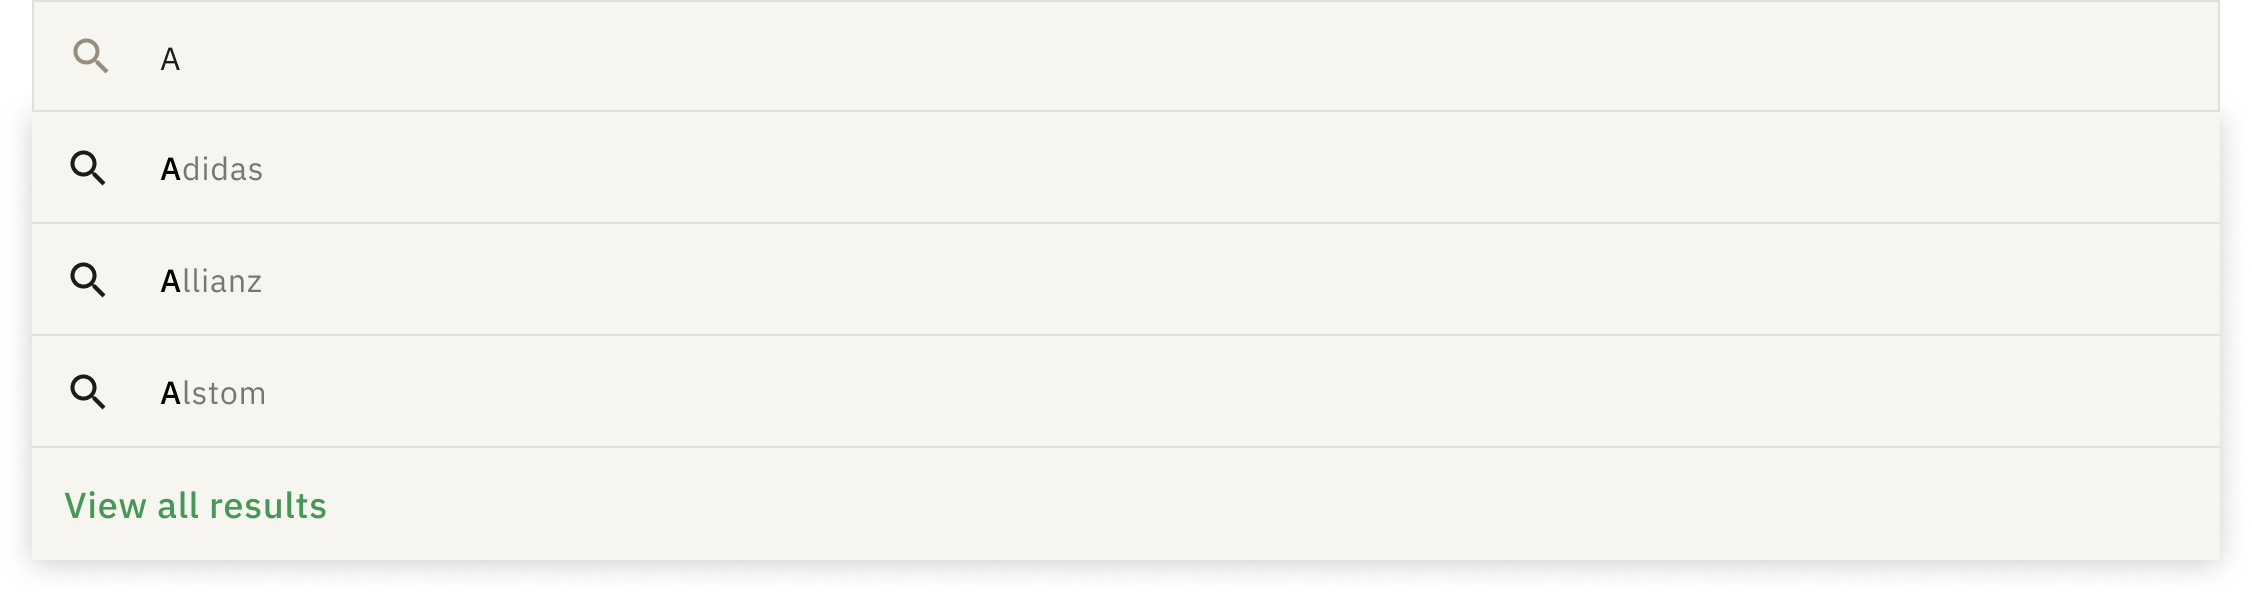
The typeahead search feature in action.
Result of companies when a user search with a letter.
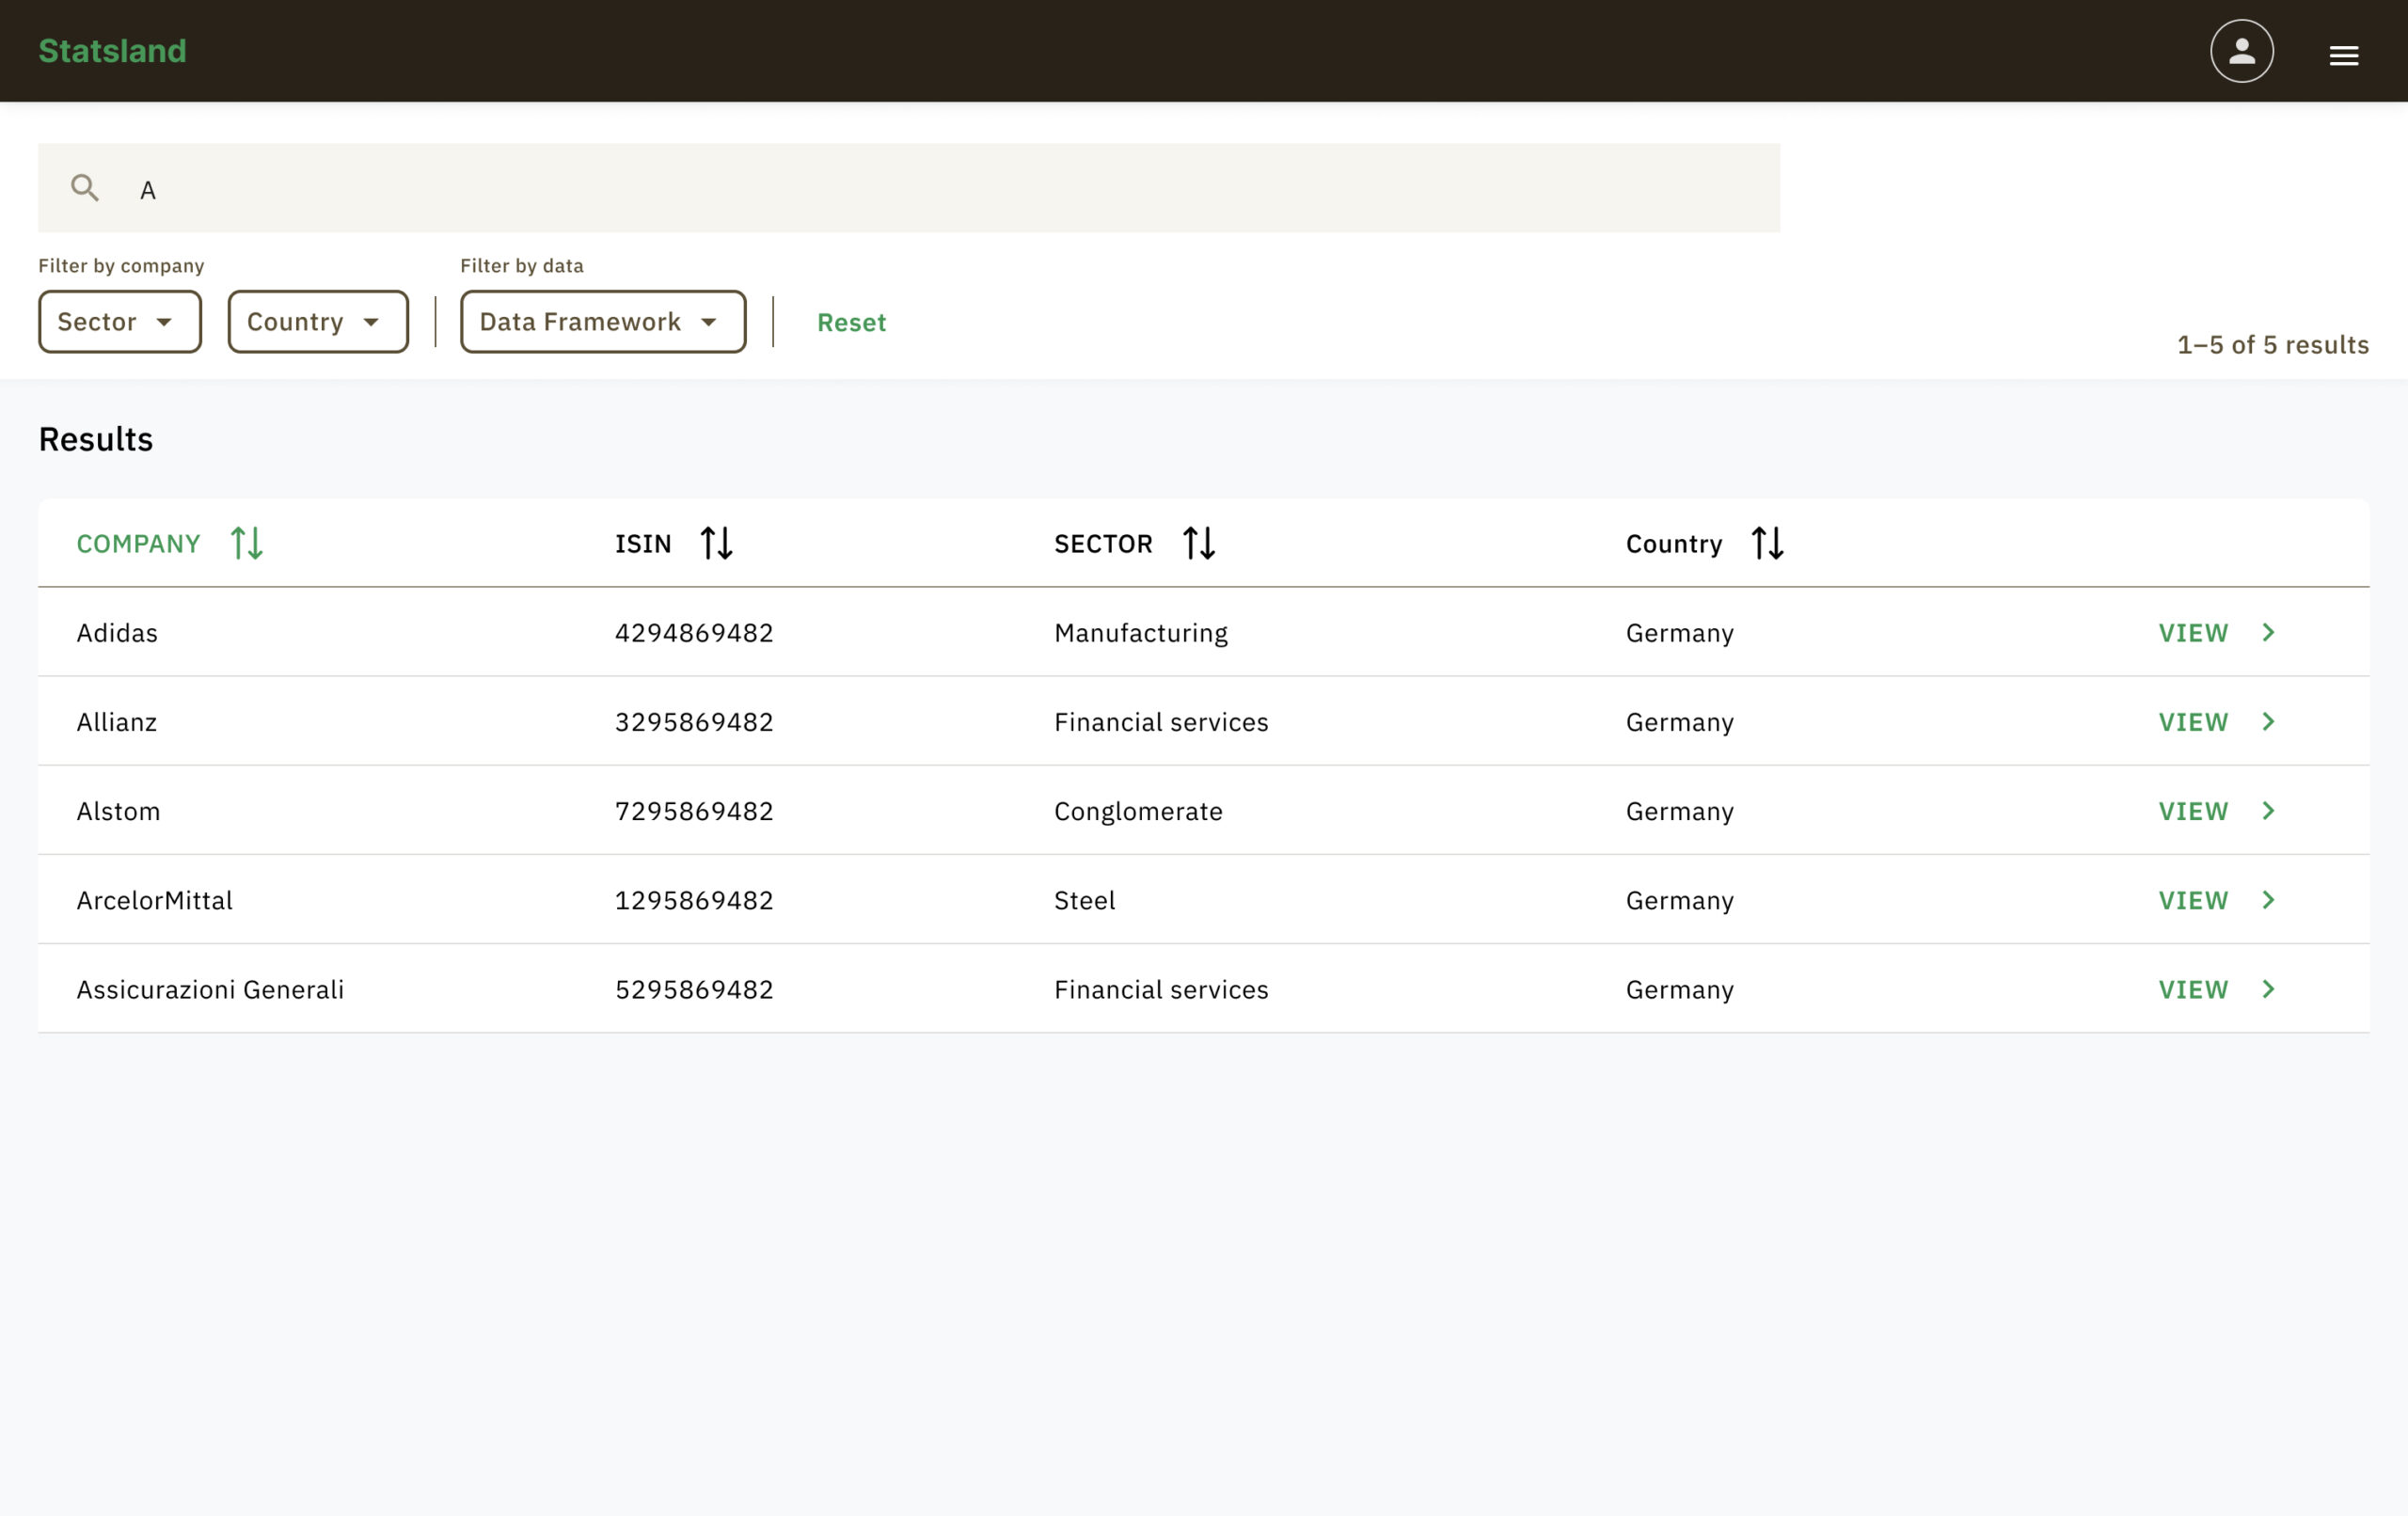
Filters as ‘Layer 2’
ESG framework, industry, geography — to explore and benchmark.

Sustainability Leaders can filter the companies based on the filters.

The result after the filter is applied is gives an overview of companies within the same category.
Displaying Data (Filters + Search)
We developed a platform for ESG data of companies that was transparent and accessible to key personas. The main focus was given to accessing the ESG data in depth, clearly and quickly. Moreover, it had avenues to challenege the presented data in case of identifying errors.
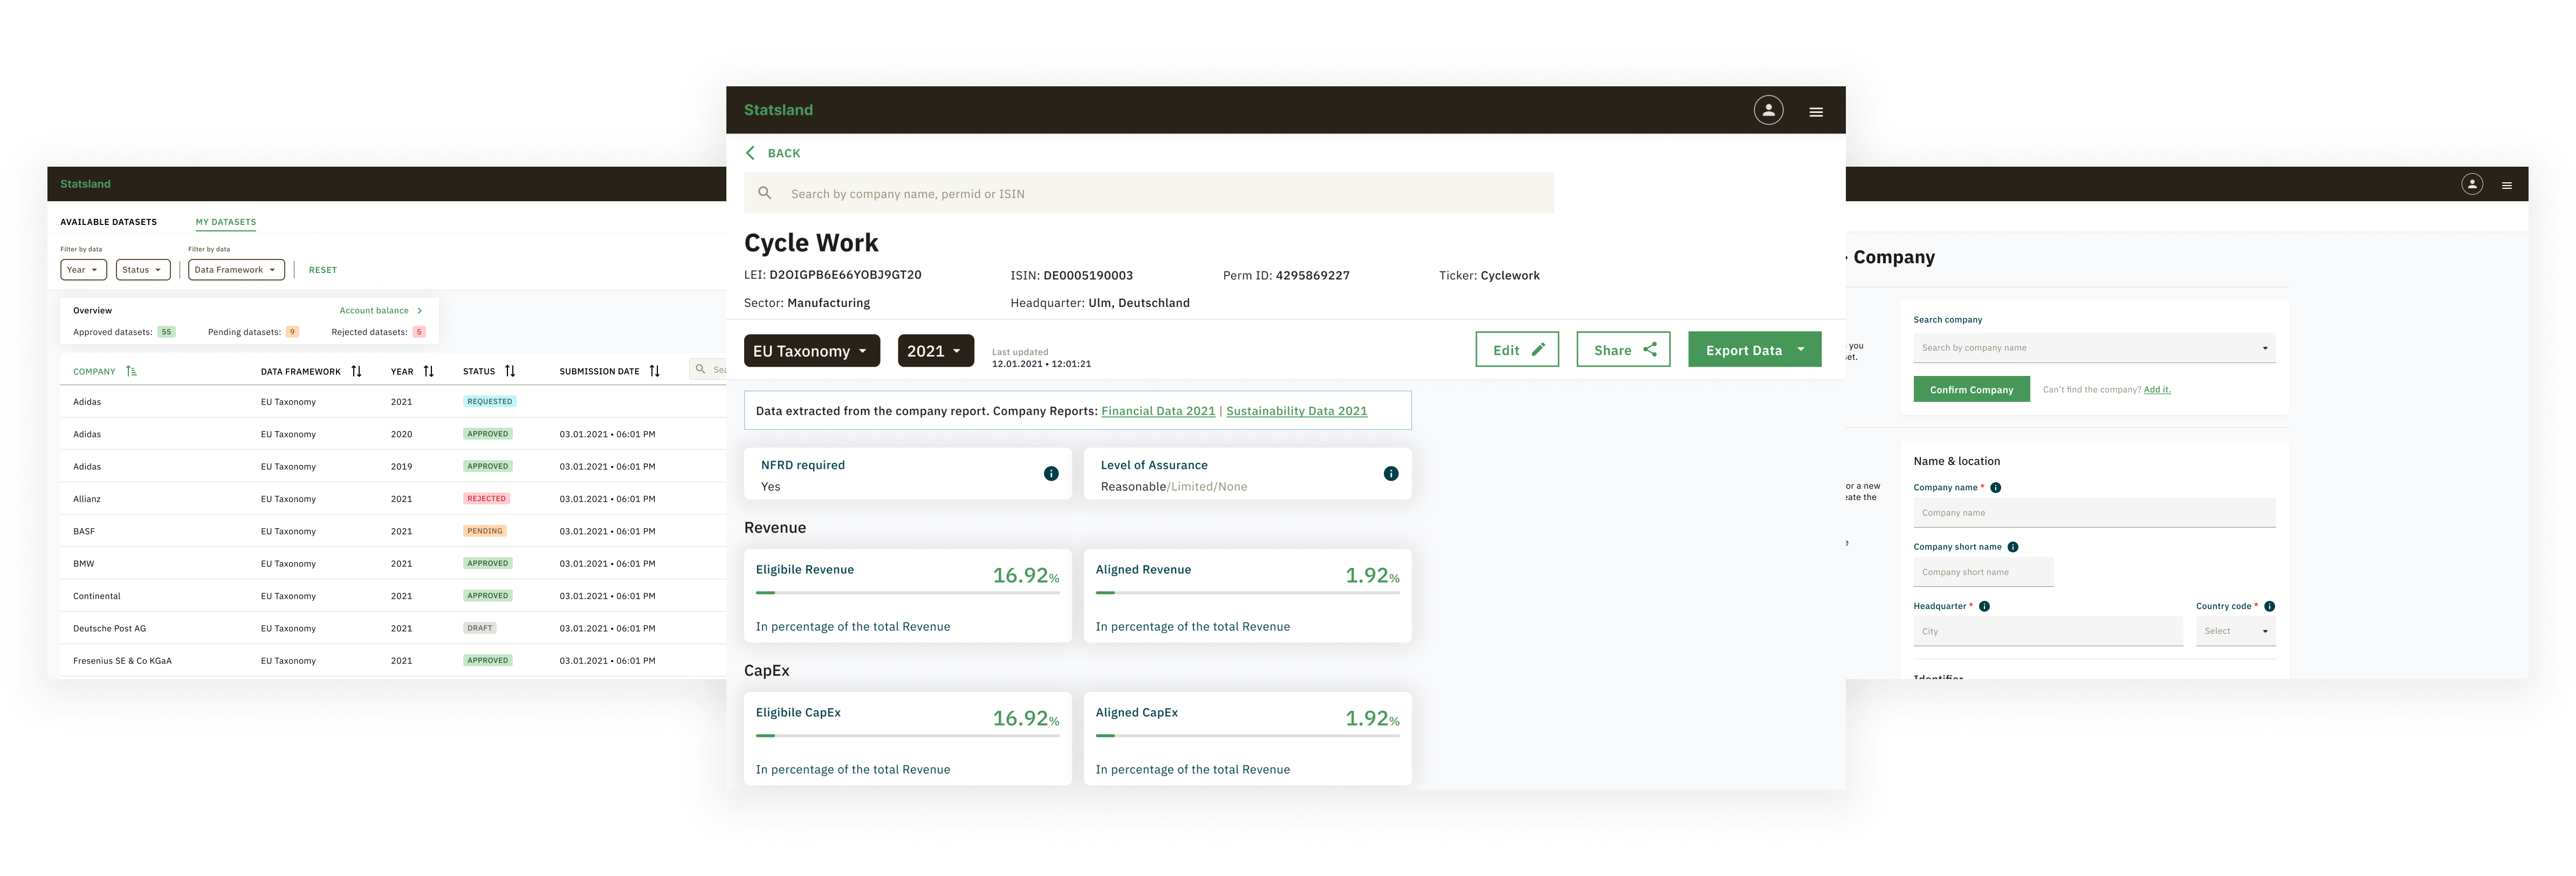

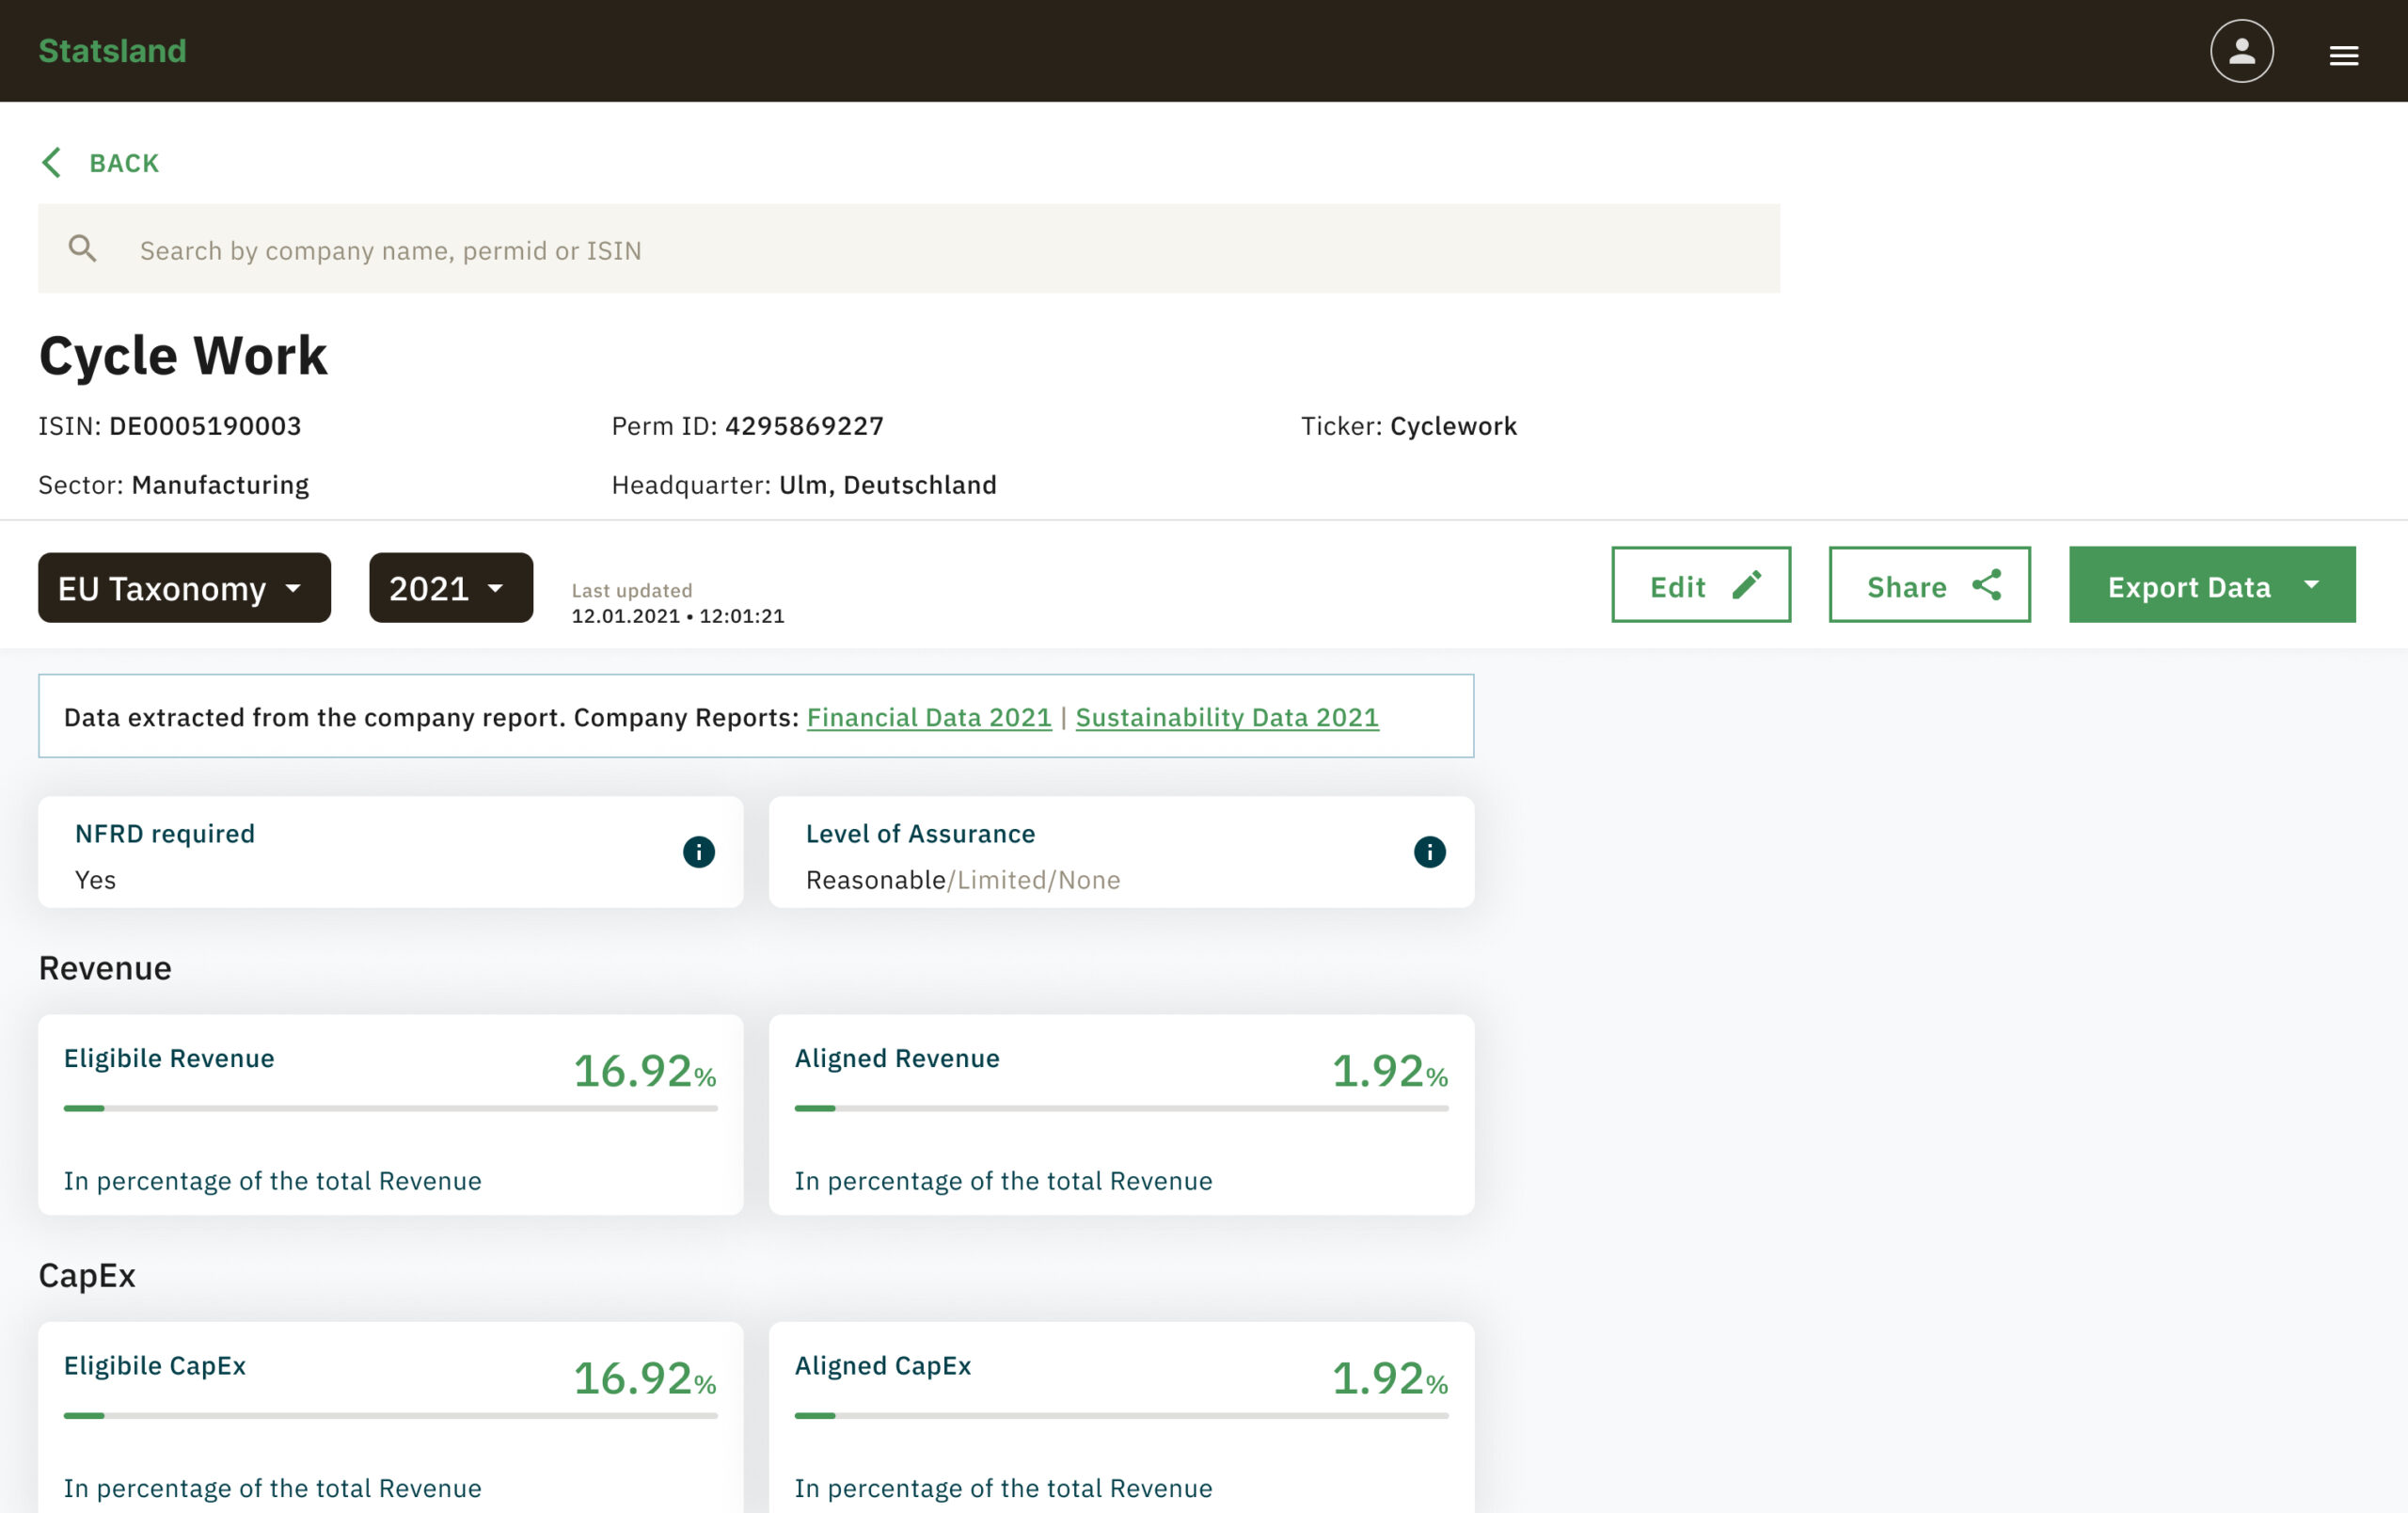
Details of a company page. Global search to navigate to any company and filters to narrow down on the results.

List of all the datasets a Data Uploader has uploaded along with their status.
Animating company's detailed data page
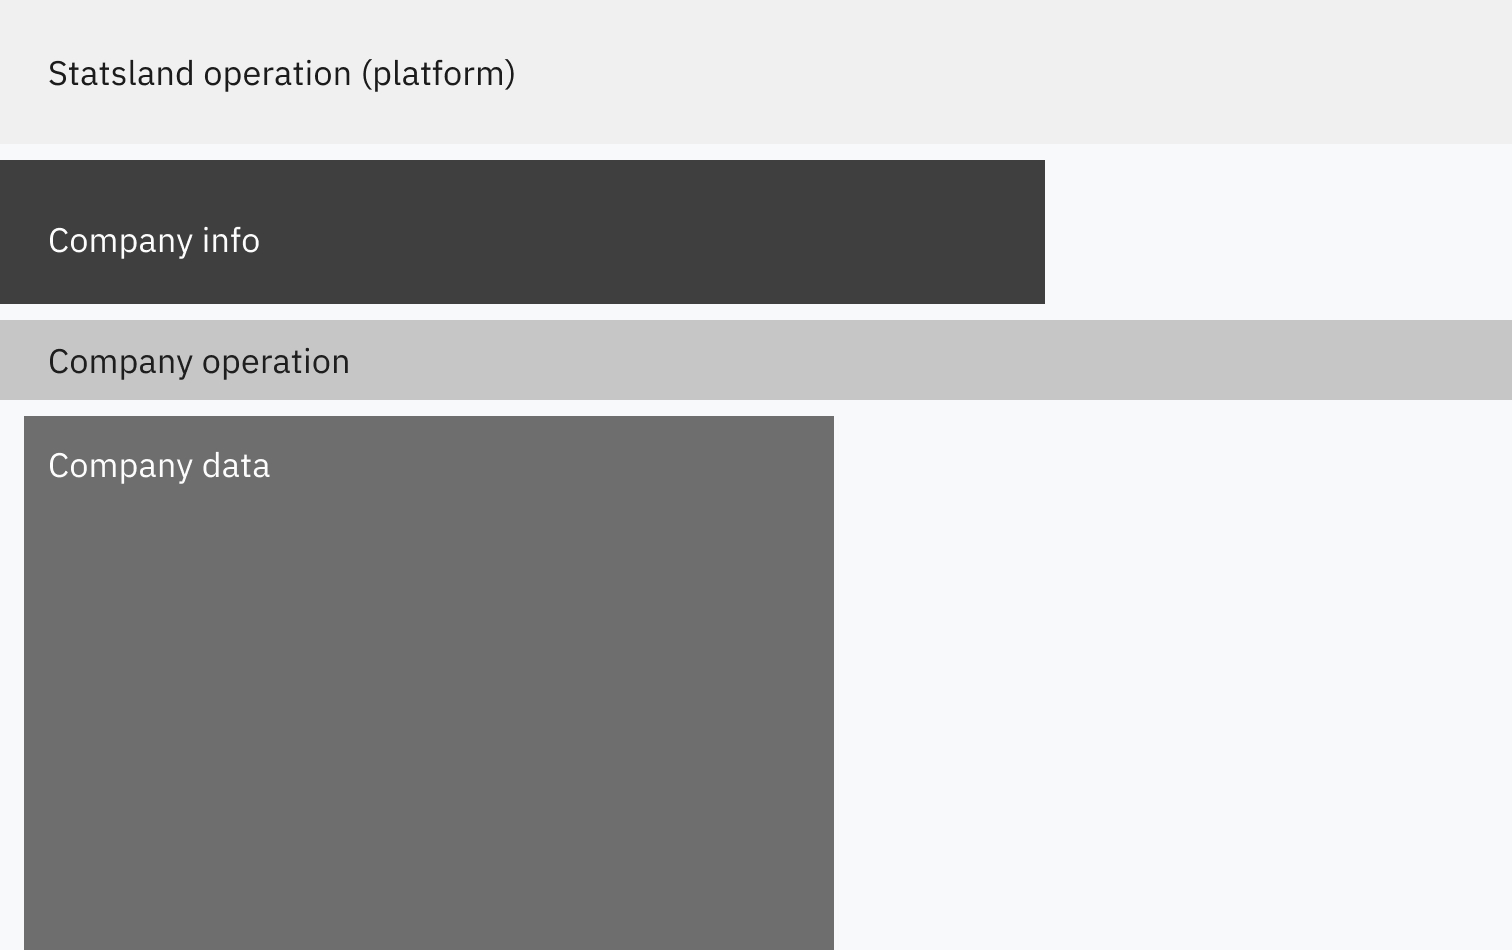
Importance of info on the page upon landing:
1. Company info 2. Company data 3. Company operation 4. Statsland operation
The company report page upon landing.
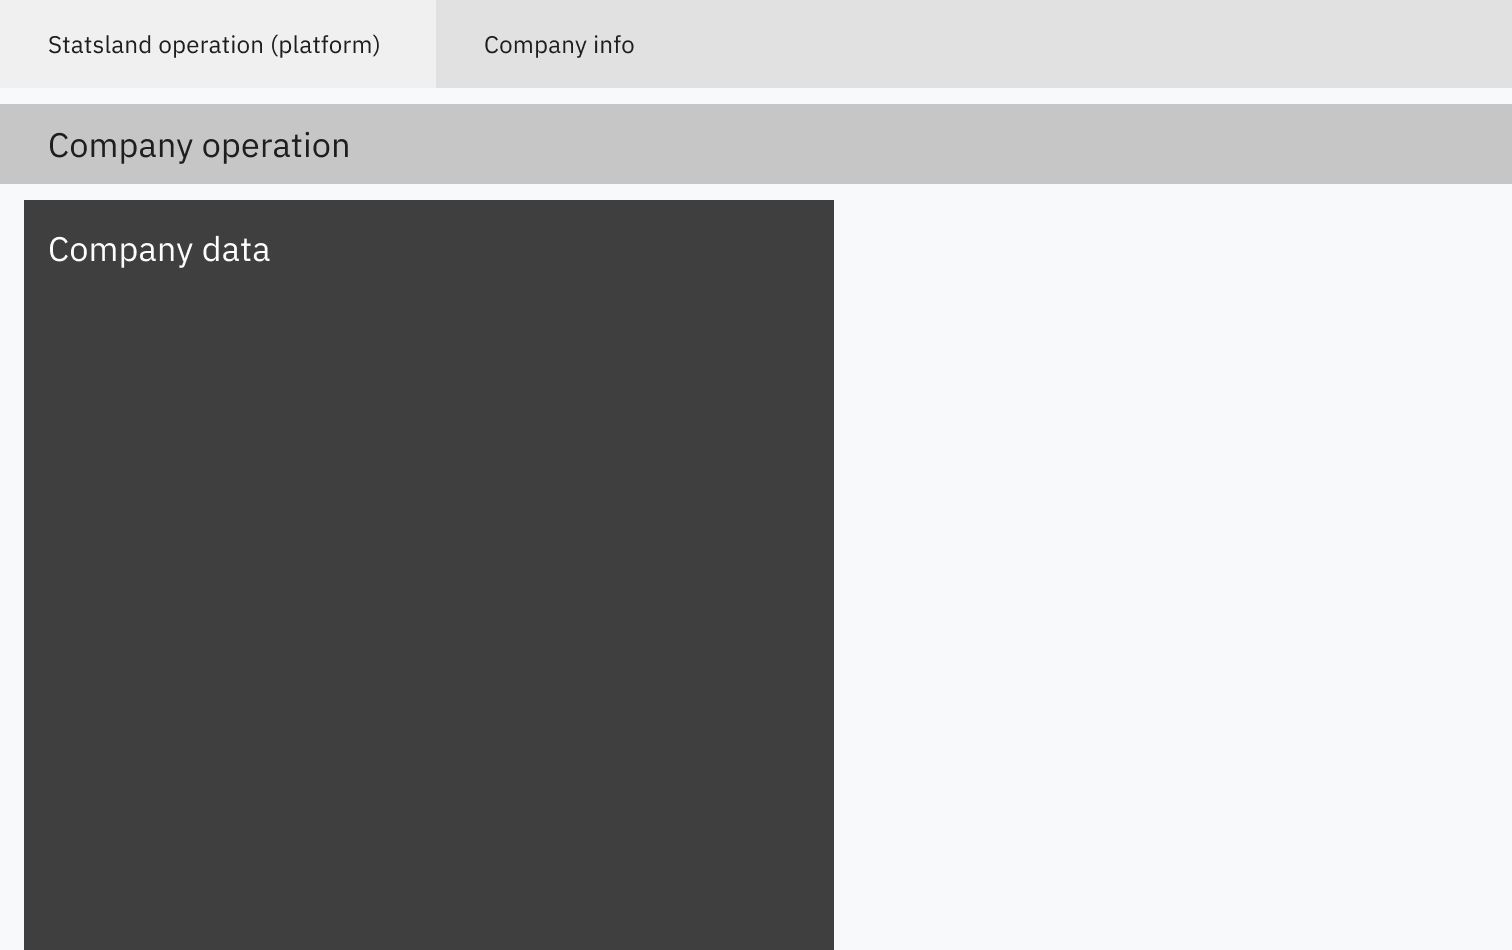
Change of importance in info on the page upon scrolling:
1. Company data 2. Company operation 3. Company info 4. Statsland operation
The shift in hierarchy when a user scrolls.

Snackbar with the download completion info as a user can goto another part of the platform.
Micro-interaction upon saving the report.
Acquisition strategies
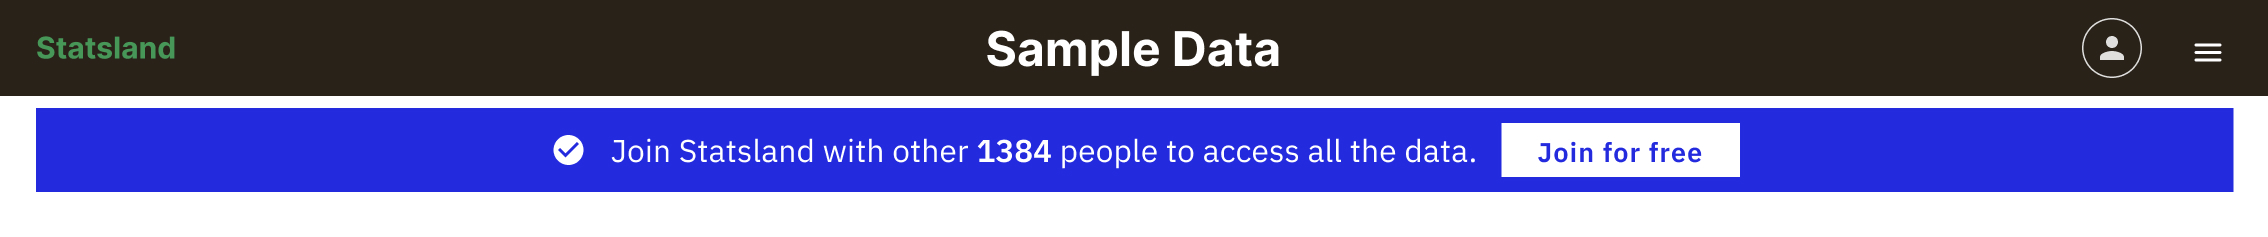
1. We offered users a taste of what they can receive—free sample data on the homepage.
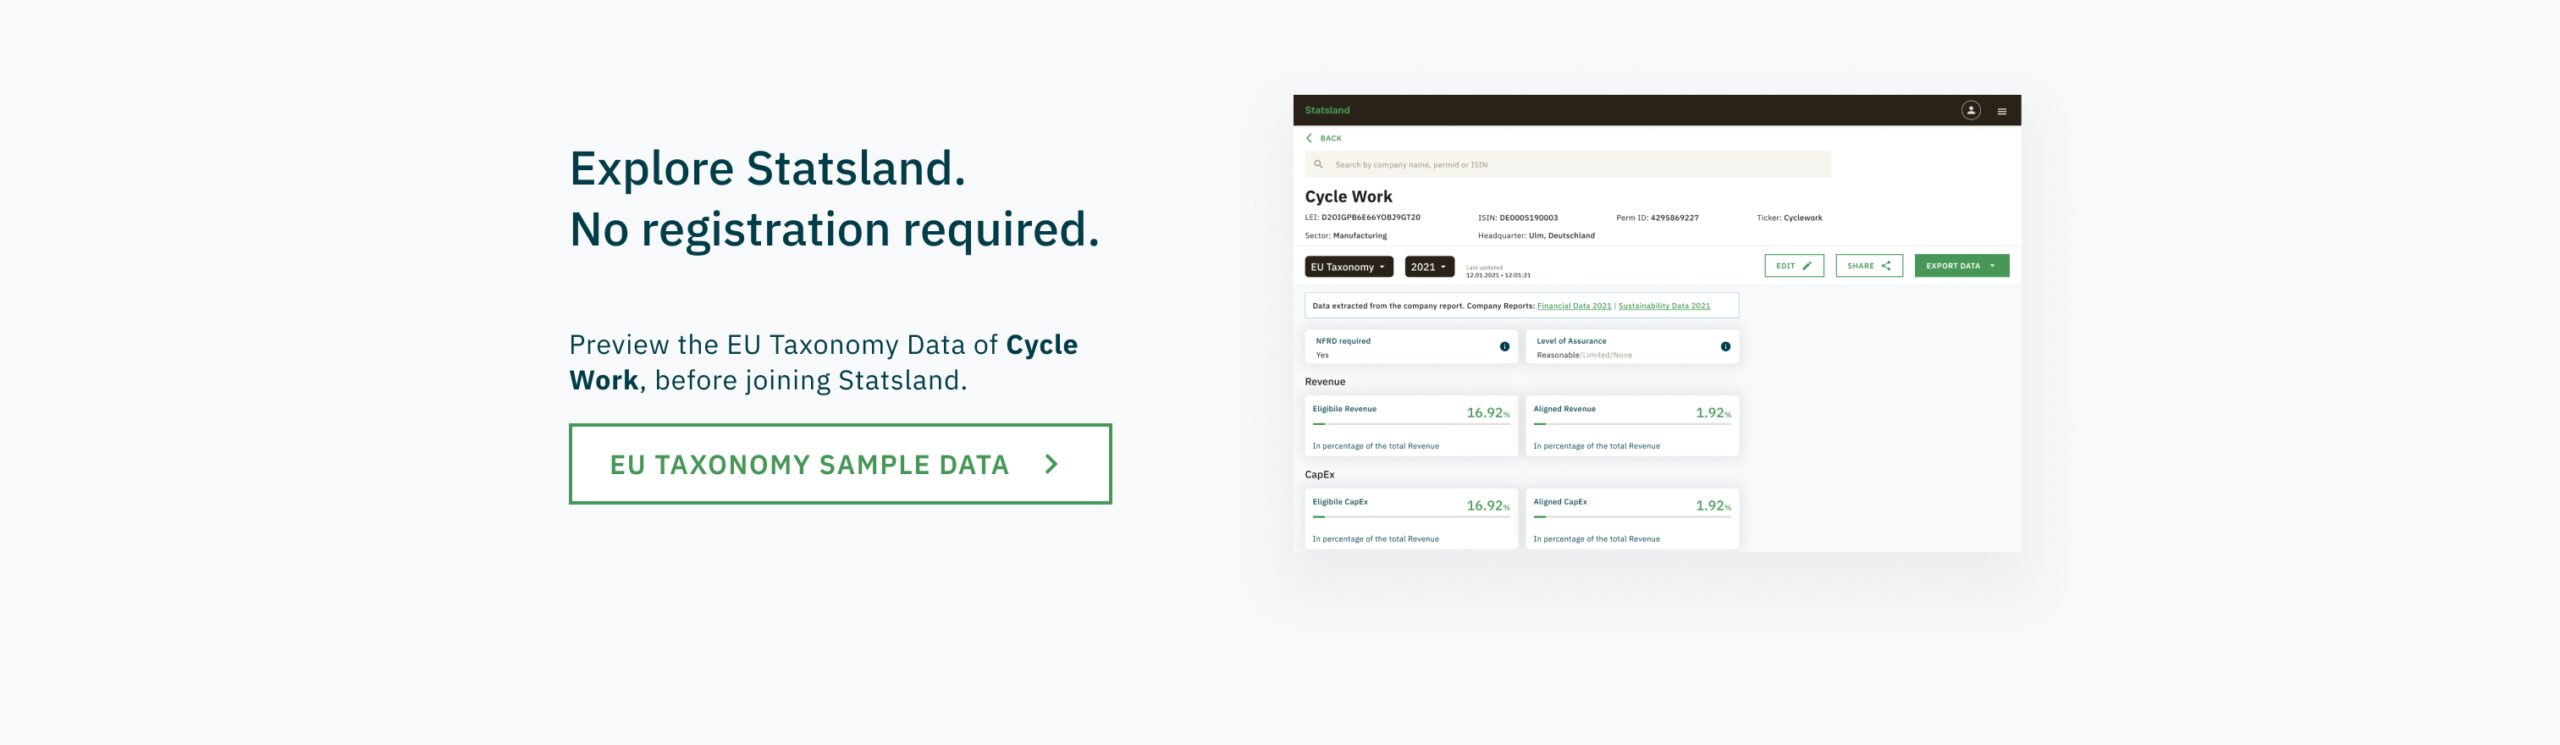
2. Once a user is viewing the sample data, show that they can join for free and view the number of people who are already on the platform.
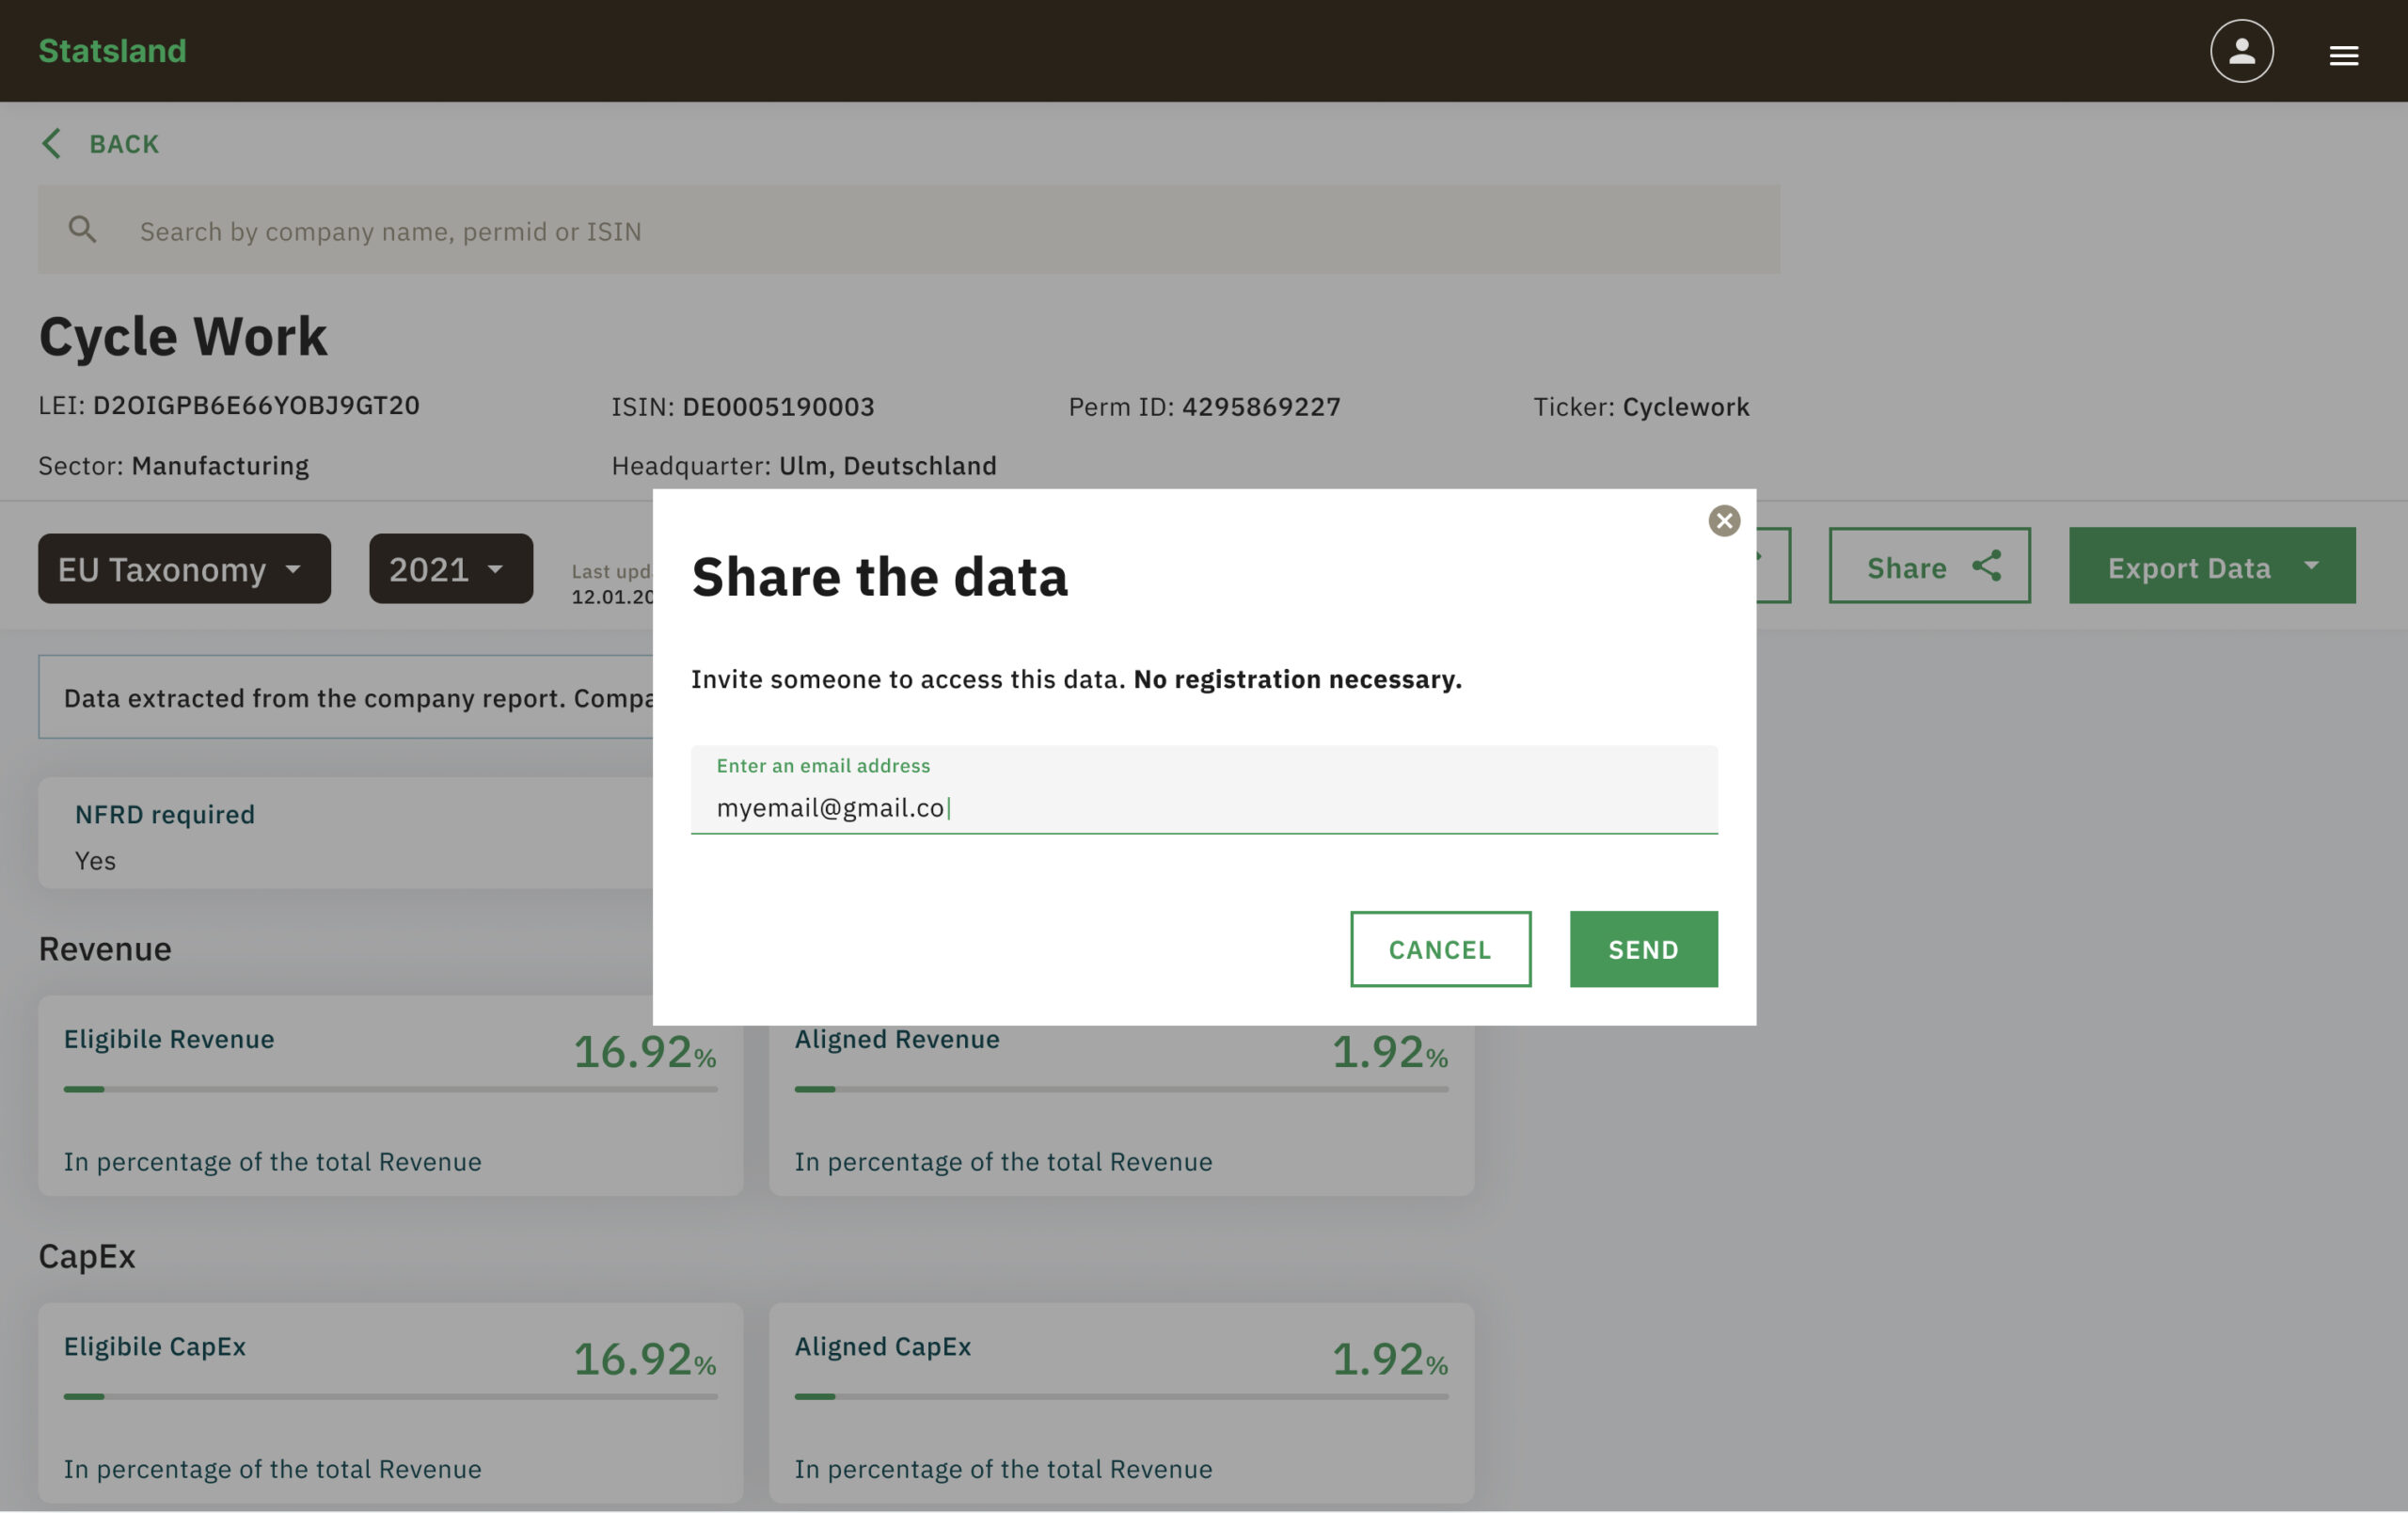
3. Share a report of a company you’re viewing to other if you have a Statsland account
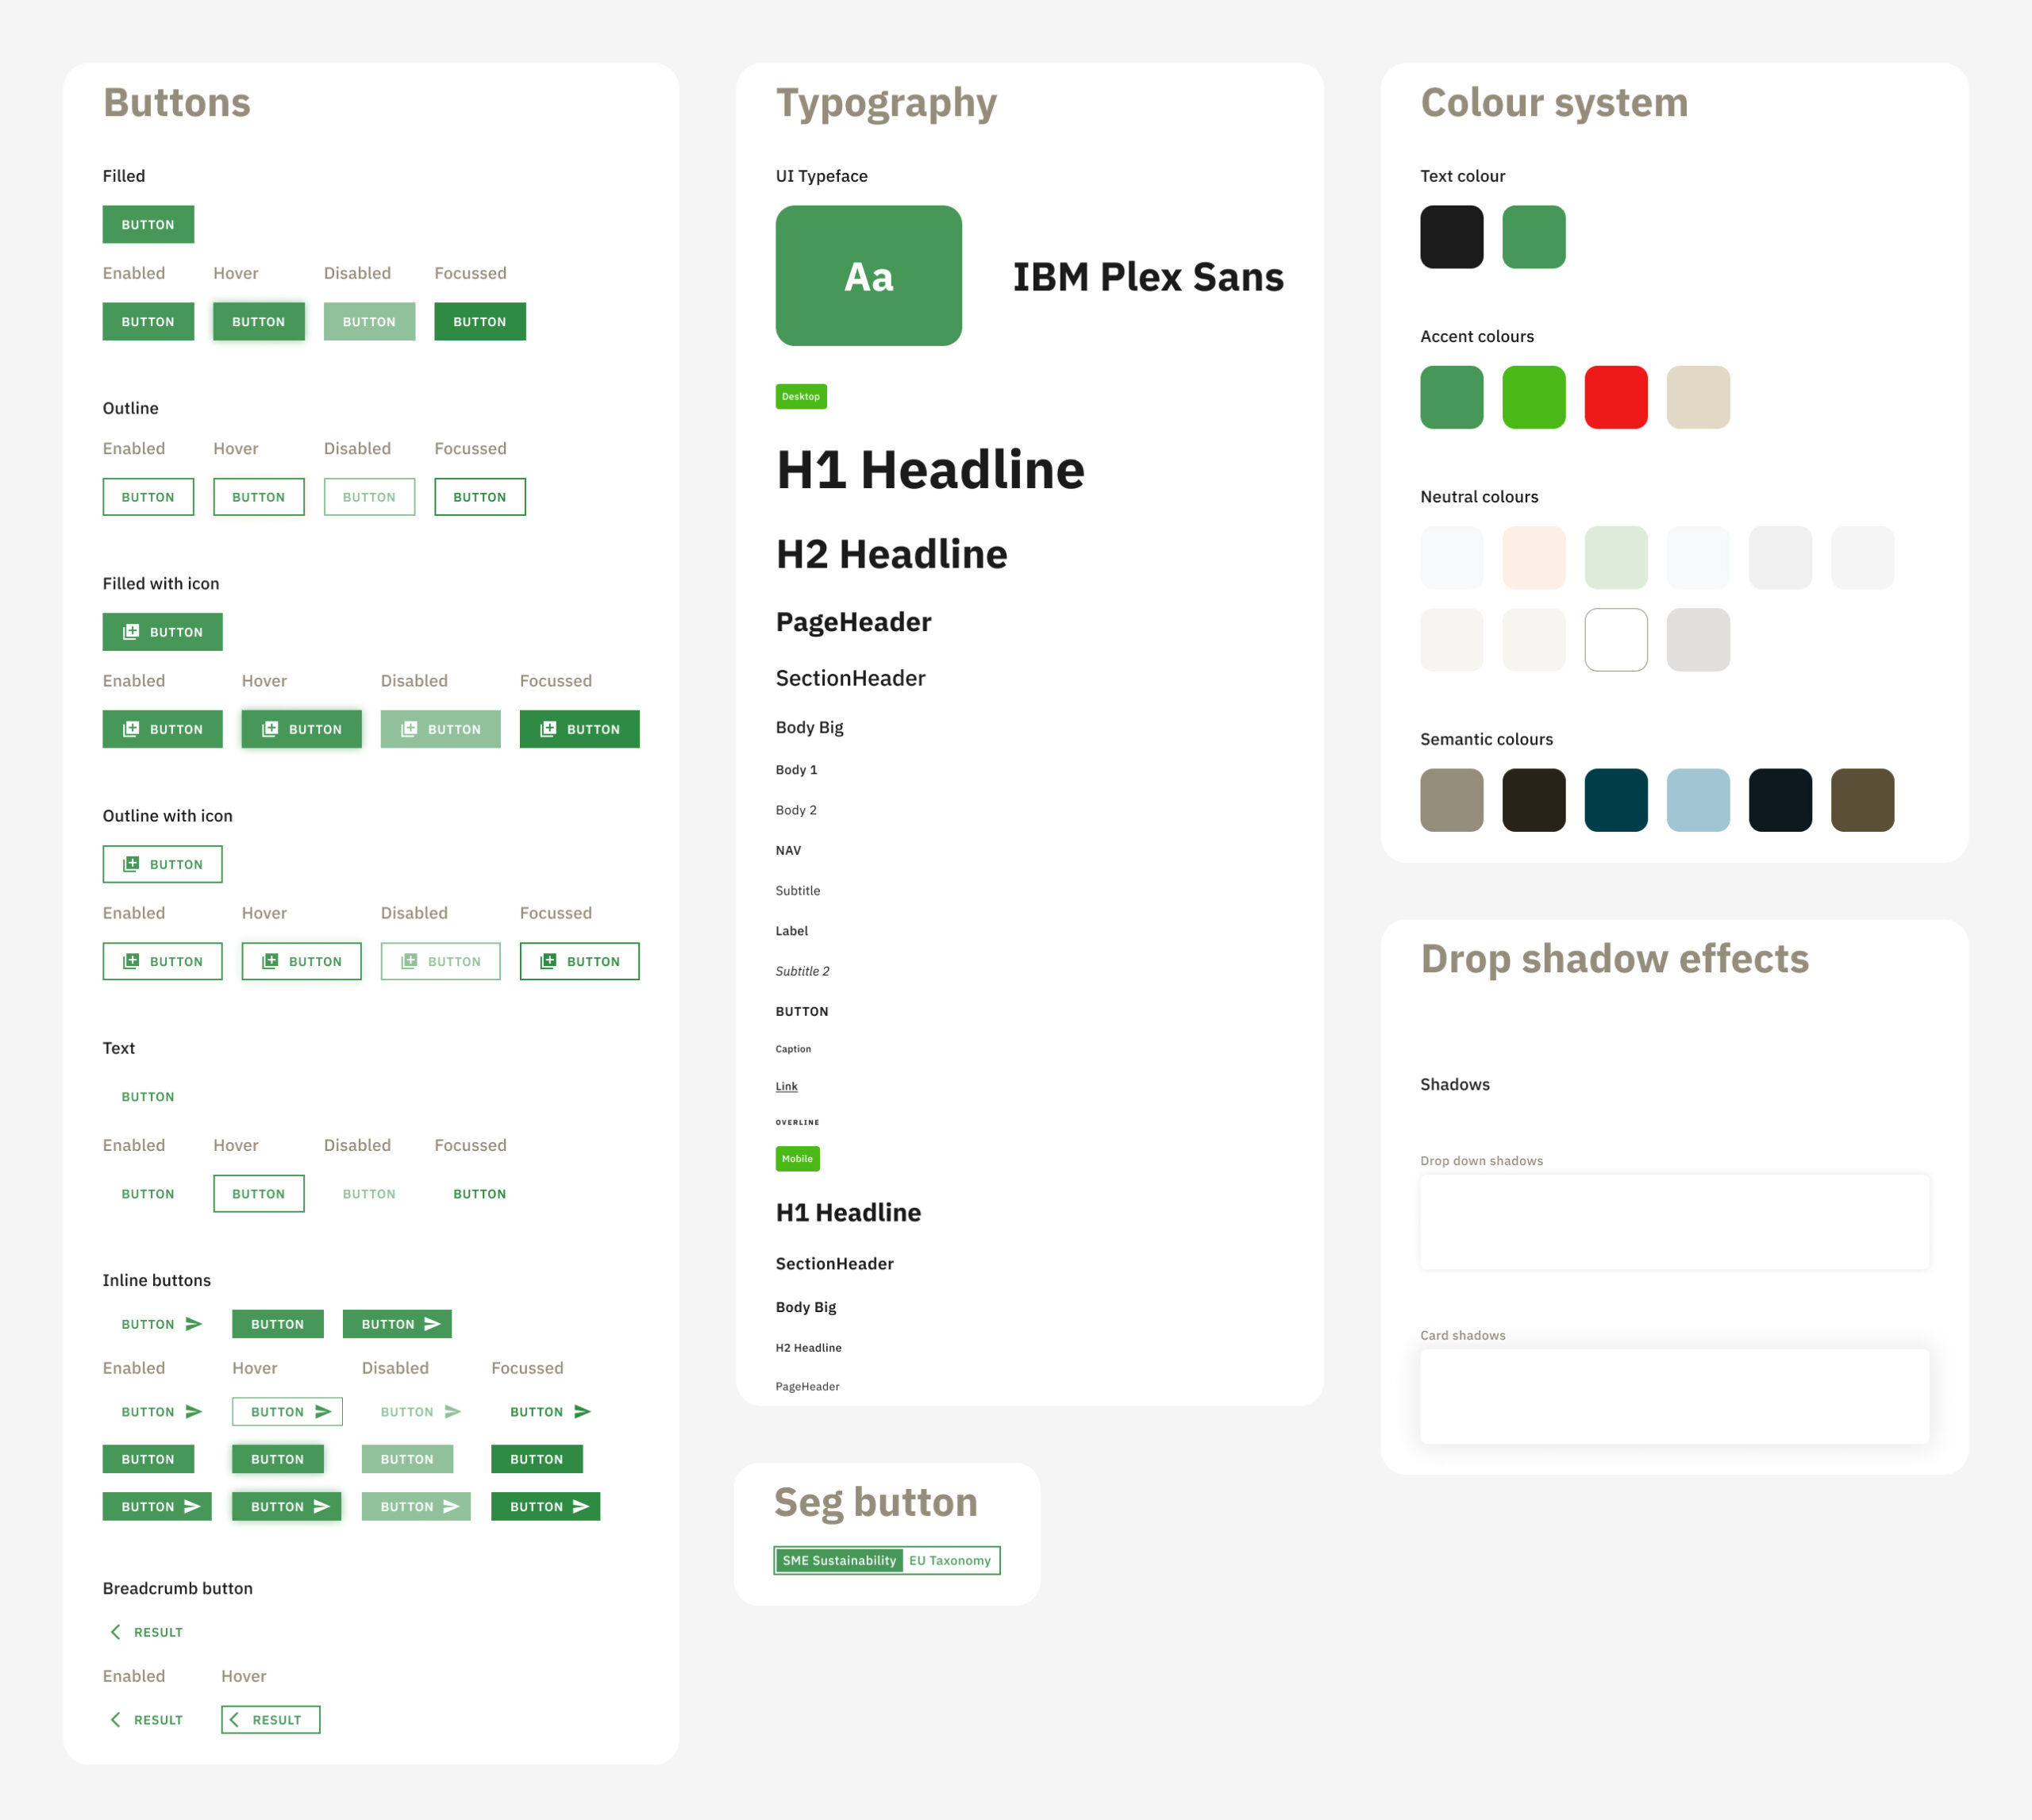
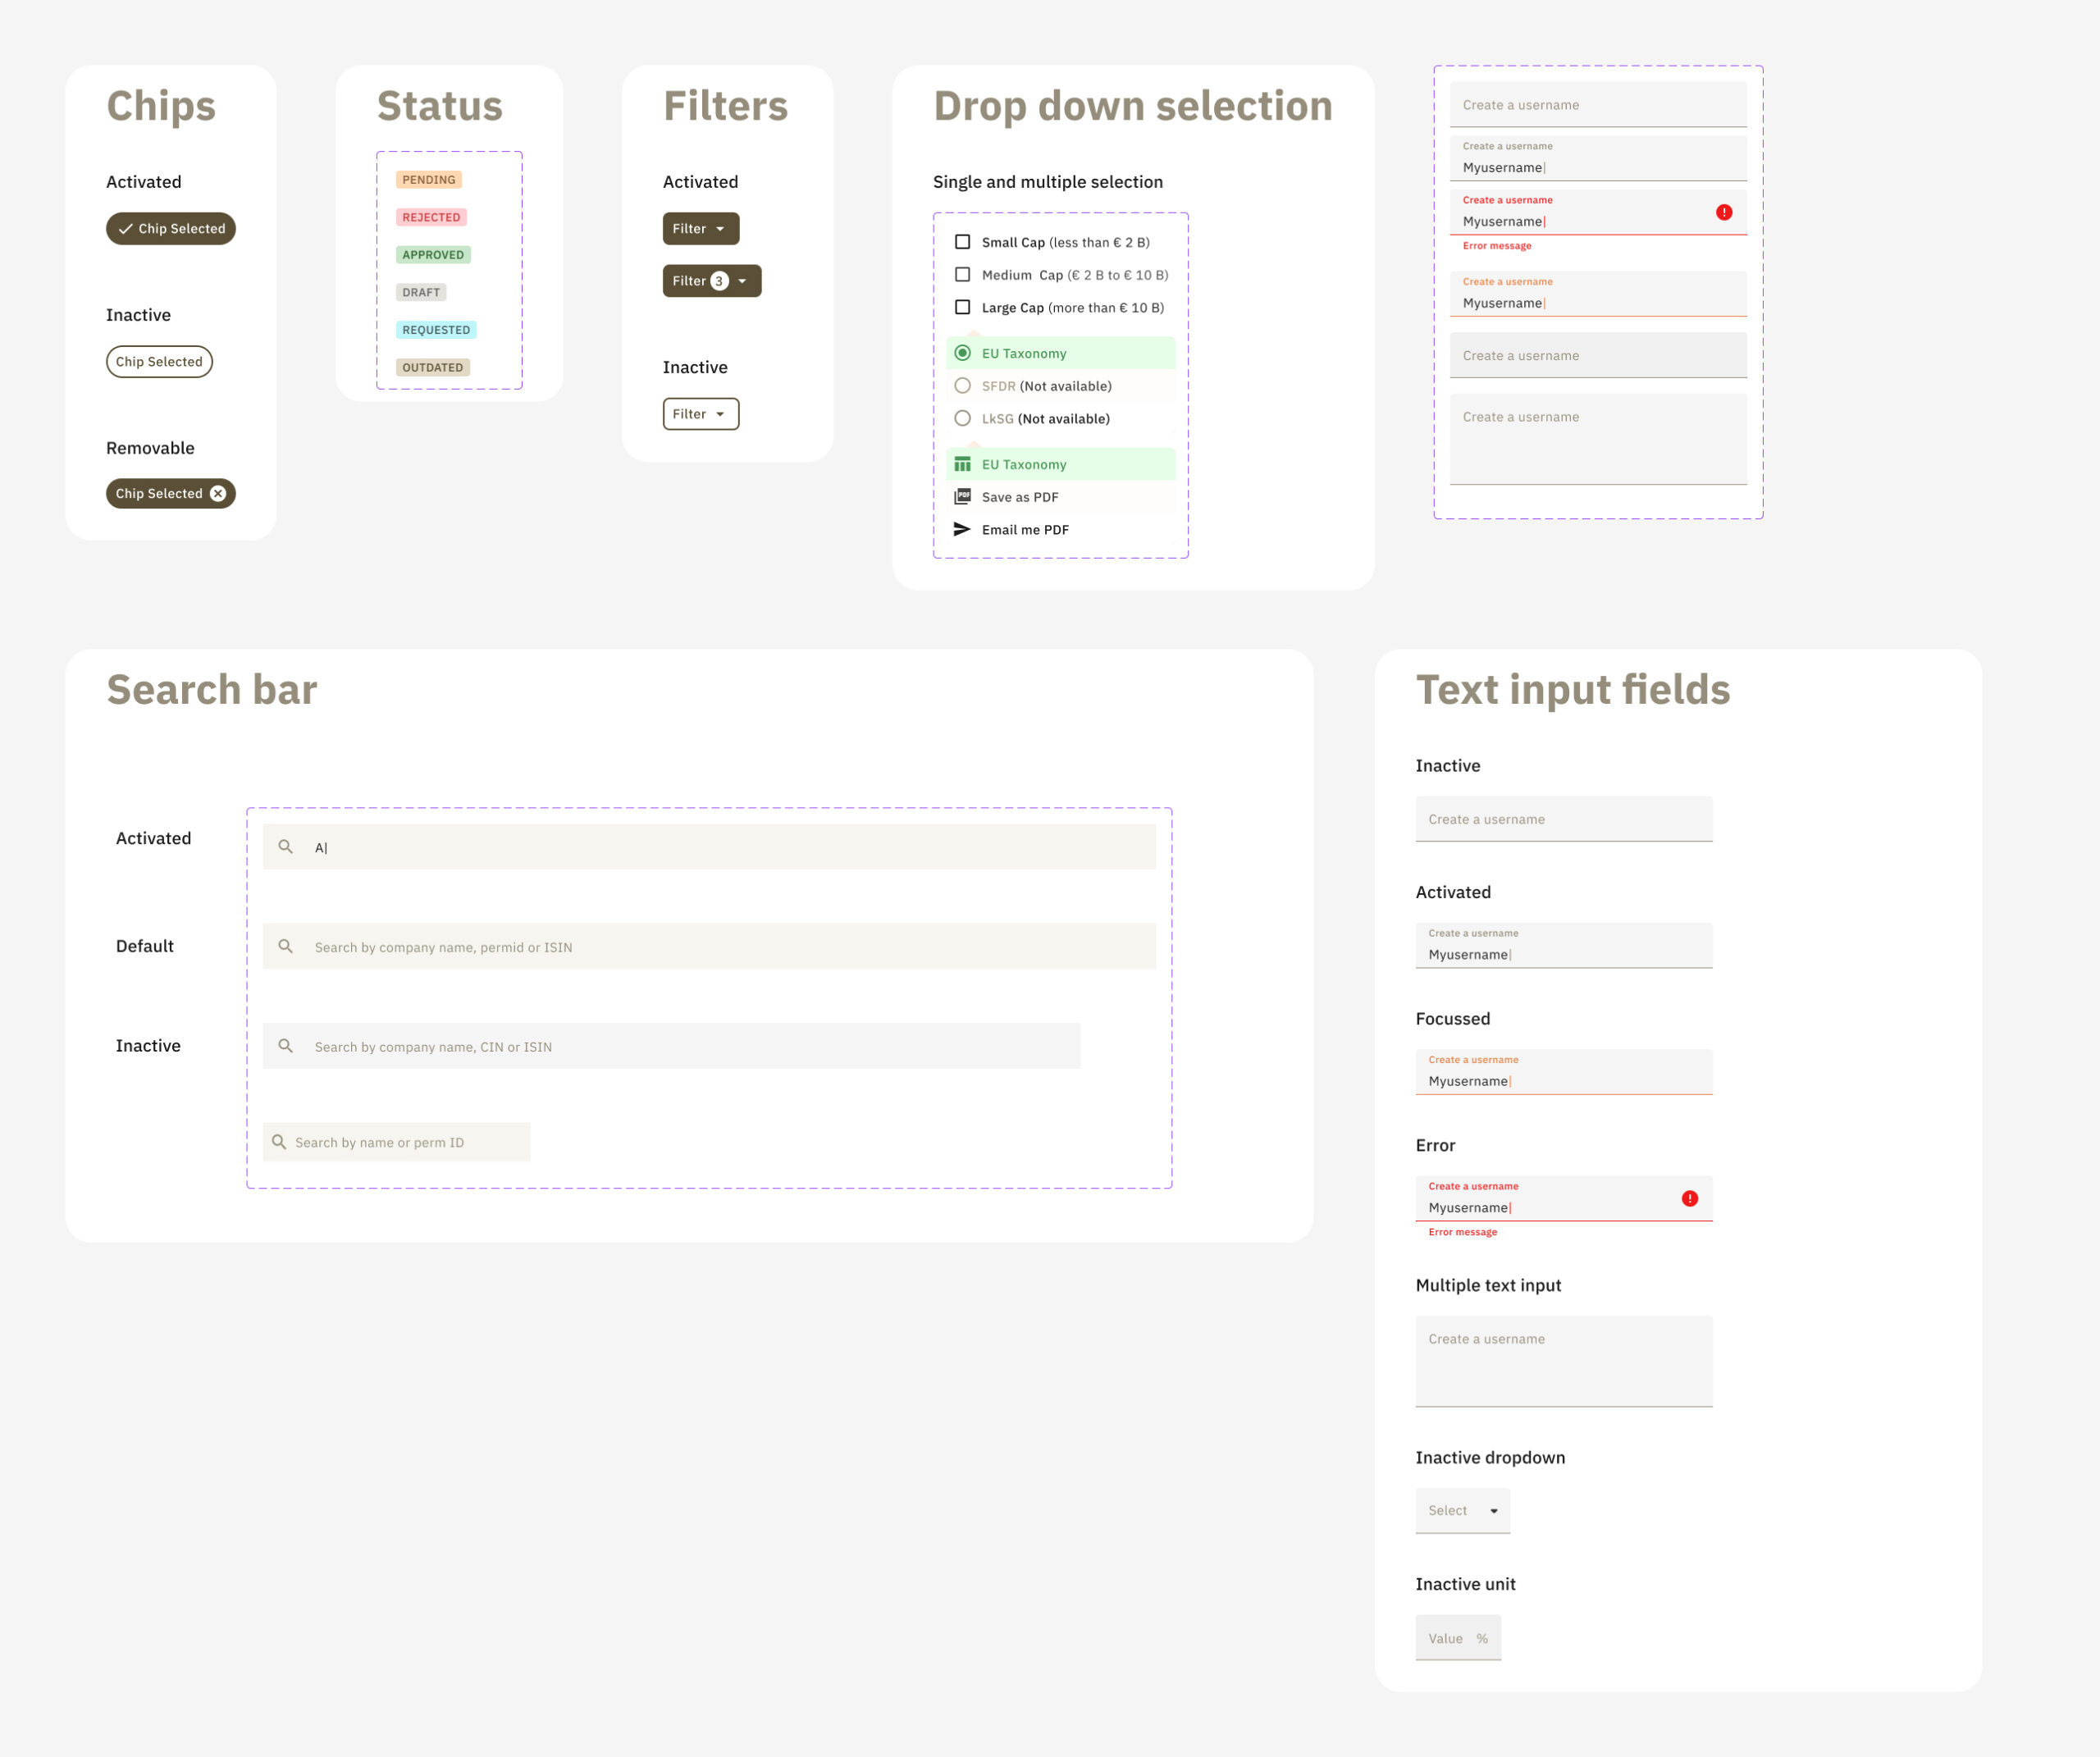
The design system
With the scaling workflows, it was important that the design library had consistent behaviour and visual design.
The development process
We constantly worked with the developers for smooth hand-offs and create a scrum methodology for development-ready design files. I'd leave comments in the development files for the developers explaining the interactions and behaviours. Furthermore, I’d audit the platform and check for consistency of implementation with the design files. We would take a screenshot, add the comments and also keep the associated design file for their reference. We would do this after communicating over our weekly call.
Screenshot with comparions for developers to make the necessary changes.
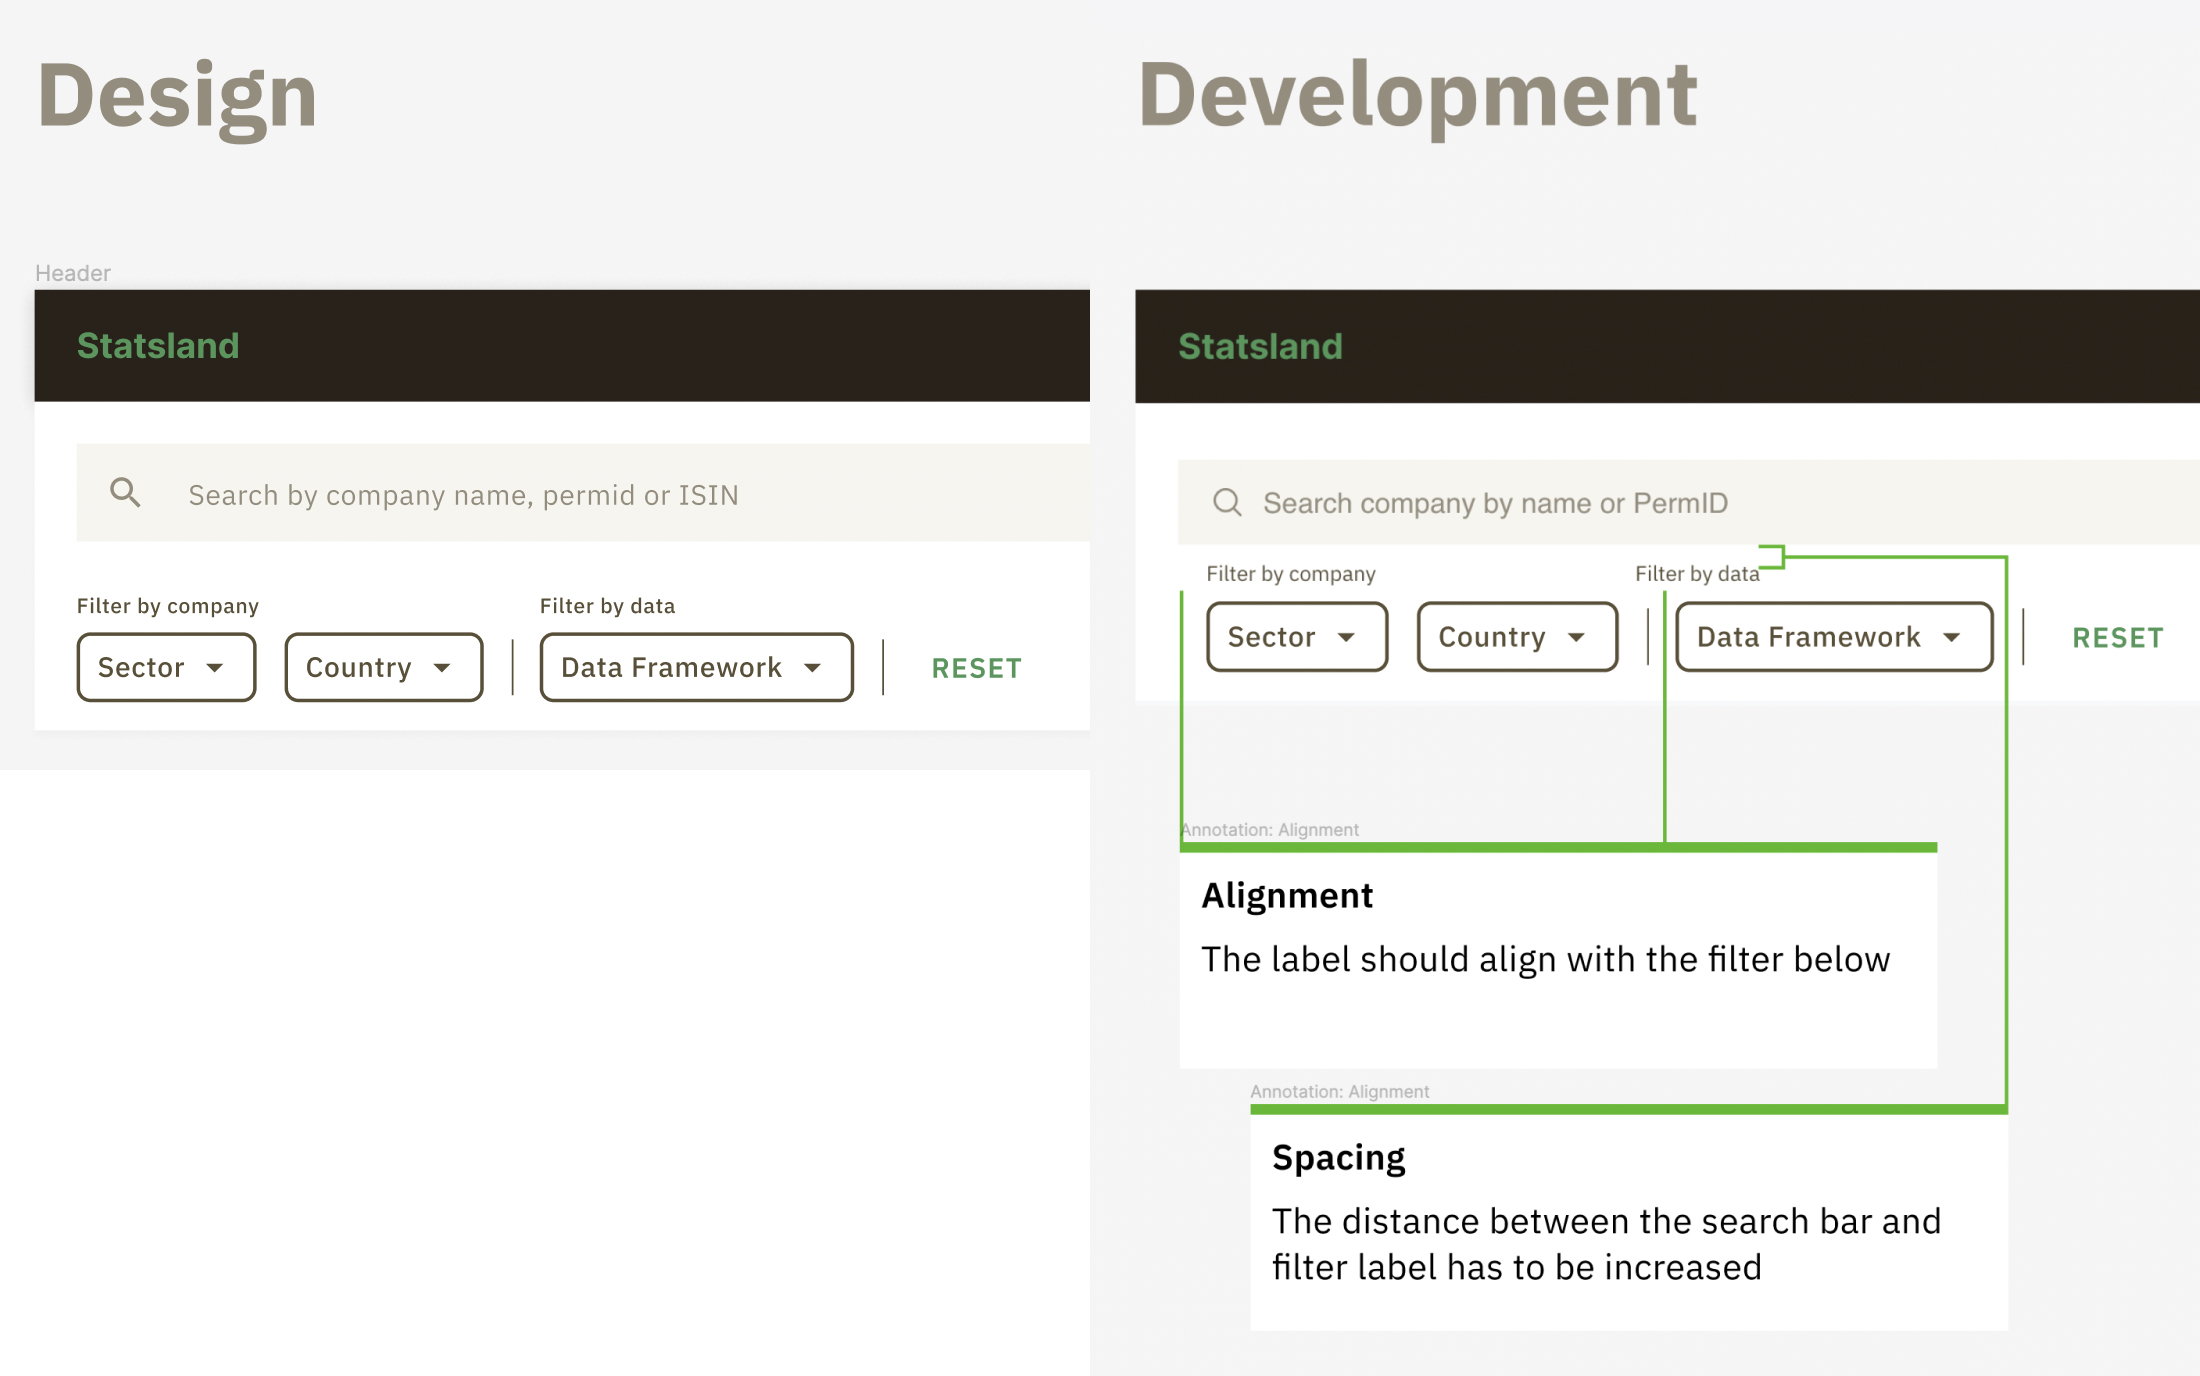
I left comments in the development files for the developers explaining the interactions and behaviours.
Outcomes
• Delivered the project within the deadline of 1.5 yrs
• Showed positive impact through user research to stakeholders
• Gained over 20 trusted partners in the platform
• Contains ESG score of over 100 companies
• Reduced data entry errors of datapoints during upload significantly
• Delivered the project within the deadline of 1.5 yrs
• Showed positive impact through user research to stakeholders
• Gained over 20 trusted partners in the platform
• Contains ESG score of over 100 companies
• Reduced data entry errors of datapoints during upload significantly
Next steps (if I cont'd)
• Work on requesting data workflow by identifying the challeneges
• Responsive version of the product
• A dashboard view for visualising datasets
• Work on requesting data workflow by identifying the challeneges
• Responsive version of the product
• A dashboard view for visualising datasets
More Projects

Zonder0–1 Launch | B2B | Healthcare
SimpleDesigned onboarding experience of healthcare workers informed by research insights. #healthcare #mobileapp

Video FacilitatorRe-designed the platform to support online workshops for large scale conferences using research methods. #B2C #workhops

NidraExperimental tool to provide relief to sleep deprived people. #collegeproject #sleep #experimental