
Statsland
Statsland
Challenge
The team had to create a platform where companies can share their ESG (environmental, social & governance) data transparently while encouraging data correction by the external community of data owners and providers.
Team – 1 UX Designer (me), 1 Service Designer
Challenge
The project aims to highlight one of the most important but underrated activities of human body; sleep. The most affected people are the ones who work in emergency services. Sleep is integral to such professionals as its an important driver for productivity on the job. The challenge was make a design solution which is physical and can evoke a visceral response.
Outcome
A web-based platform where ESG (environmental, social & governance) data of companies are sufficiently available without any inconsistency and companies don’t control who can access their data to prevent data manipulation.
Outcome
A web-based platform for Clinicians tailored for tablets for convenience and mobility.
Live version cannot be shared.
Responsibilities
Client engagement
UX/UI Design
Prototyping & testing
Concept development
Assistance in qualitative research
Context
ESG (environmental, social & governance) data provides companies with a comprehensive understanding of their environmental impact, social responsibility, and governance practices. Collecting and analysing ESG data enables organisations to identify areas of improvement and implement strategies to enhance their sustainability performance. Hence allowing companies to set meaningful targets, measure progress, and communicate their sustainability efforts to stakeholders and also helps organisations align their operations with global sustainability goals and contribute to a more sustainable future.
Patients with diabetes usually generate ulcer wounds in their body. This happens due to poor blood circulation and leads to prolonged healing process for the ulcer wounds. Prior to the project, the process to administer treatment and medication was paper based—making the patient’s journey and retrival time for the records, longer.
Expectations
The client and other stakeholders already have a vision of the product. Initially I helped them realise the workflows that’s defined by them into beautiful digital interfaces.
Gradually I started working in product discovery and strategy where only the problems in the product were communicated and I had the freedom to solve those problems using the design approach that suited best.
Approach to the project
Design approach
Worked with the stakeholders initially to gain trust and gradually introduced prototyping and testing as a means to validate concepts. Simultaneously collaborated with developers in implementation and audited the developed version regularly for ensure accurate implementation of designs.
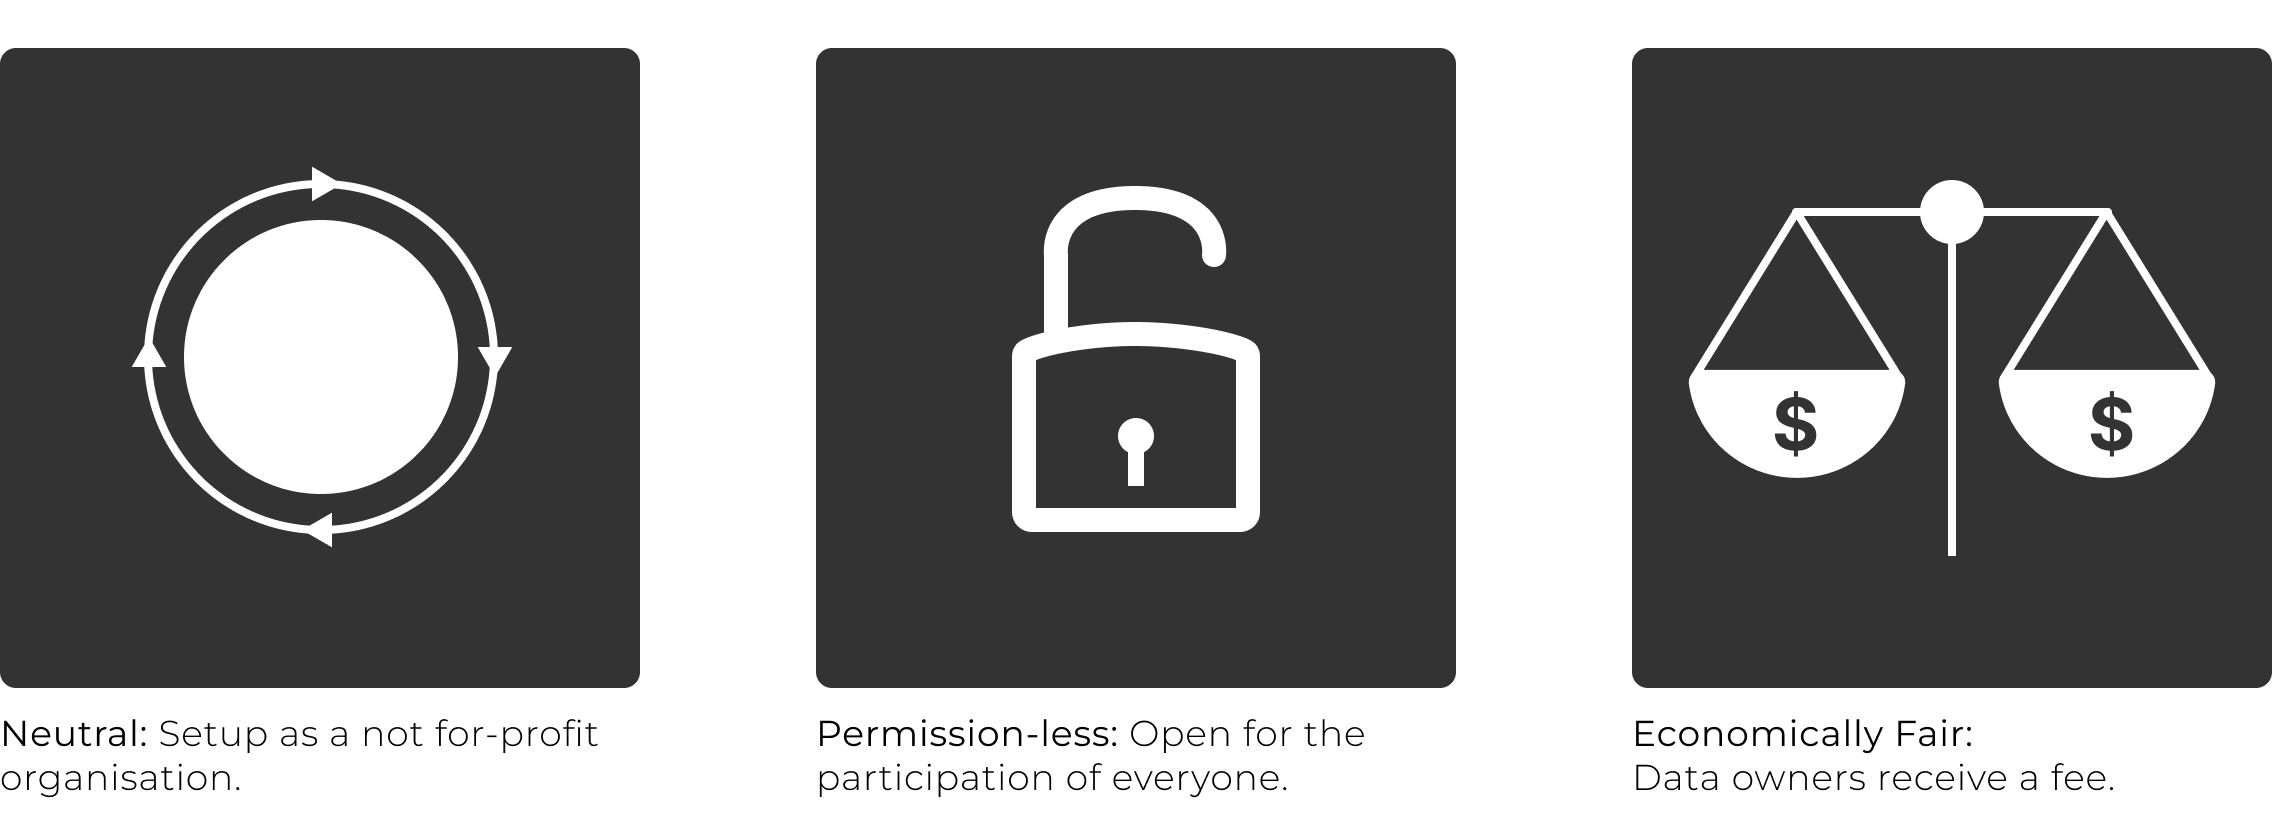
Statsland is a web-application with an open ecosystem for companies to exchange ESG (environmental, social & governance) data in a neutral, permission-less and economically fair way.
Working method
We were working on a product that's very useful to the companies and to the planet but there's very less awareness about the topic. Our source of truth were the stakeholders whose words were gospel for our design. Other platforms that provided similar services were radically different to what we wanted to achieve. So doing research with limited resource was difficult.
We would understand the demands coming from the stakeholder and translate them into problem statements. This would then help us define the goals of what we want achieve. This would serve us as the North Star to all our ideas and concepts. The method of working with developers and other stakeholders was scrum based where depending on the nature of the workflow/feature/research/testing, timeline was allotted, priorities and re-worked on if needed.
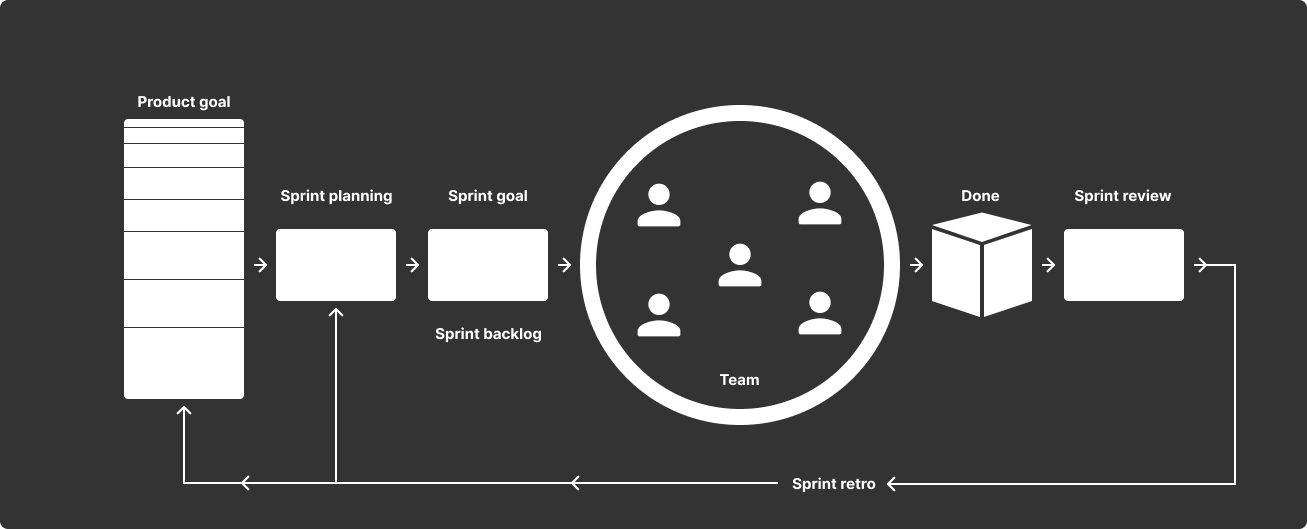
My interpretation of scrum that was followed while working with developers and other stakeholders.
The vision of Statsland
Statsland as a solution to ESG data. We had to create an open ecosystem for companies to exchange ESG data.
The starting point and chasing the launch
We were on an aggressive launch date due to a prominent tech conference where we wanted to show and launch the version 1 of the product. Therefore the scope of the product was decided on the feasibility of development by the deadline. I collaborated with the internal stakeholders to understand the ecosystem of the platform. Creating a service blueprint helped visualise the flow of both external and internal facing parts.
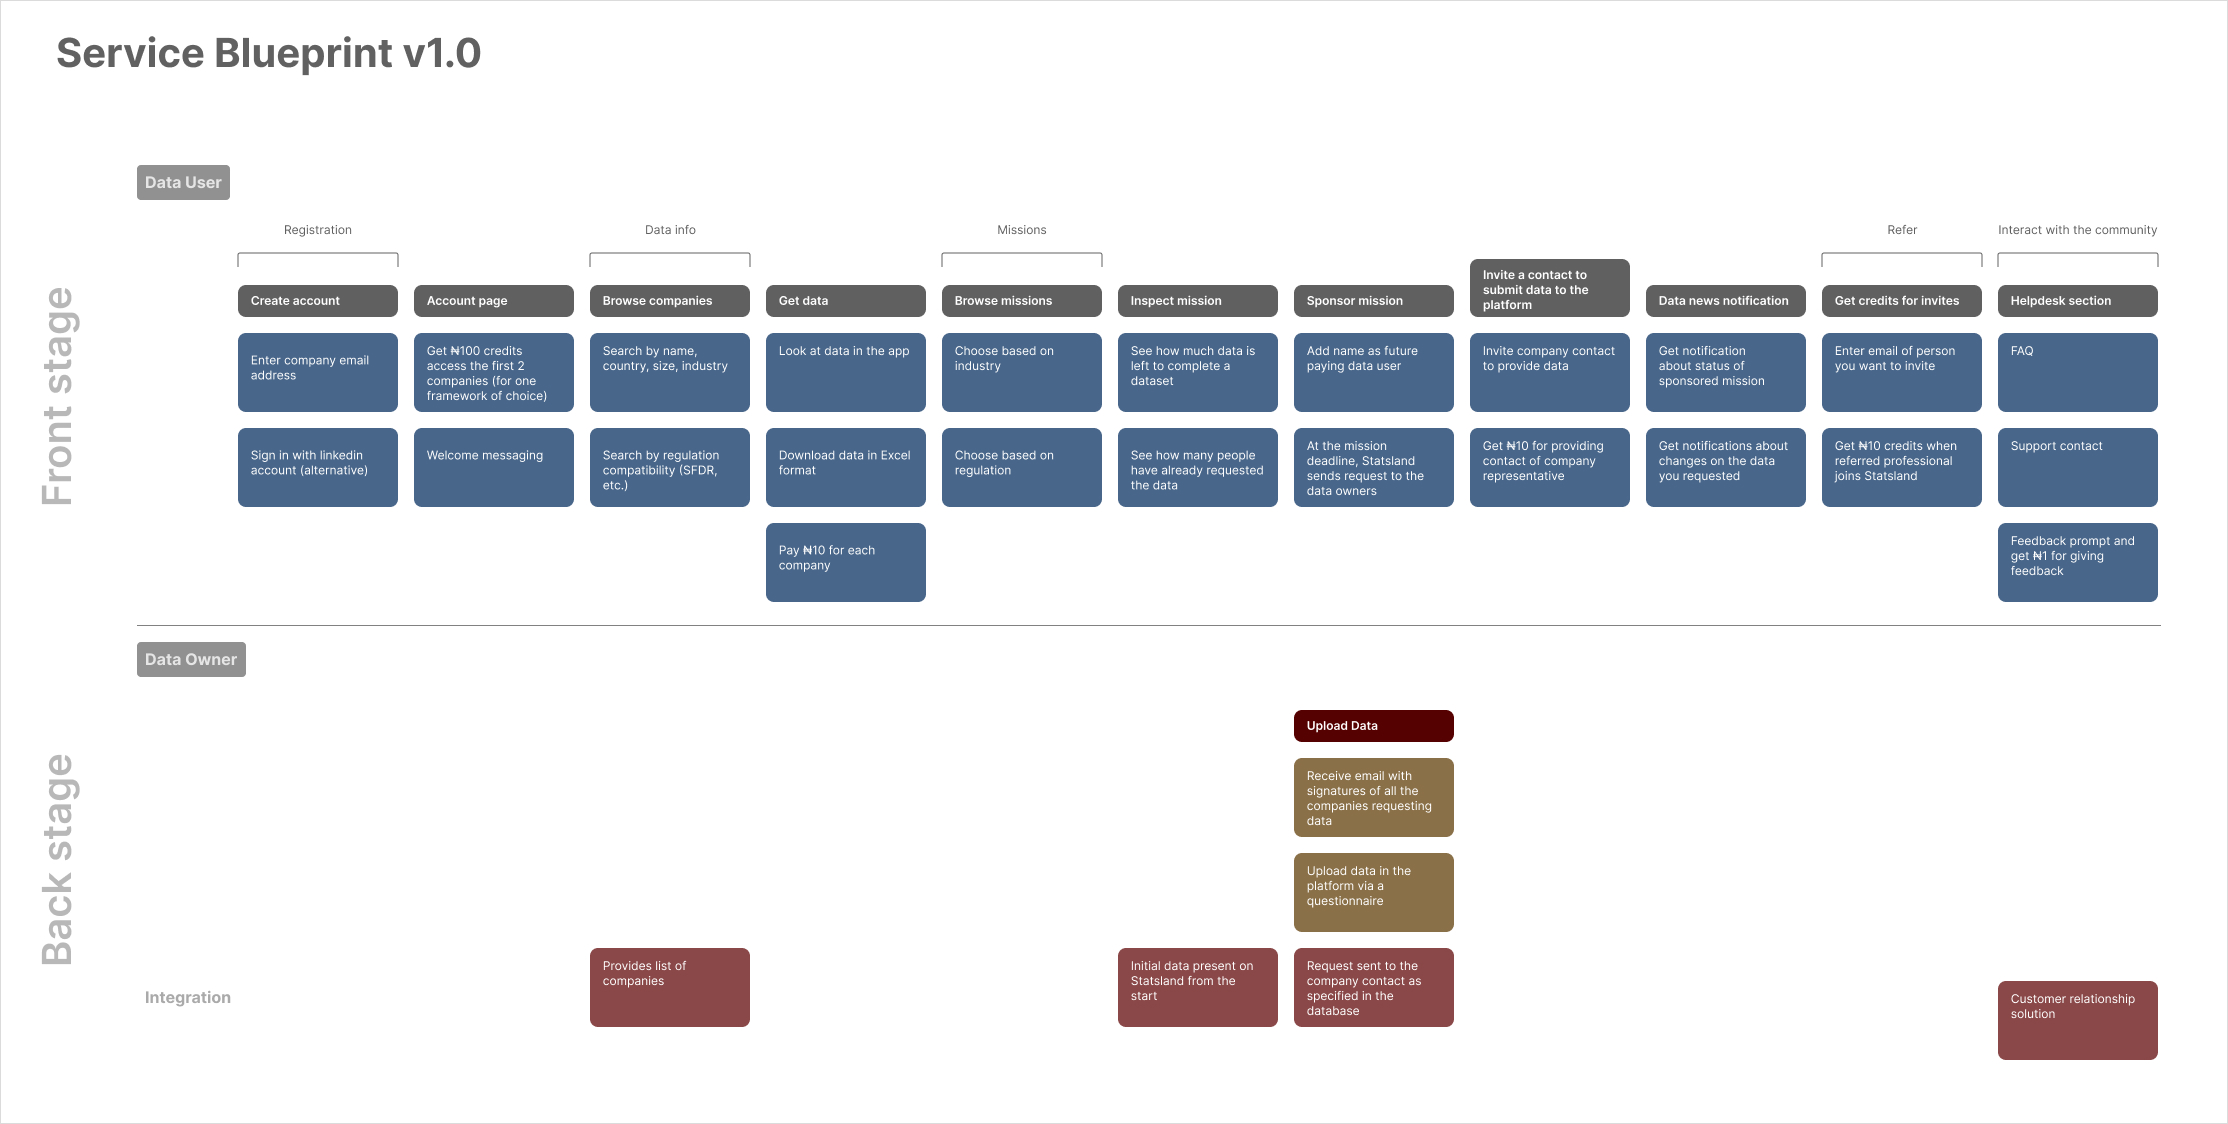
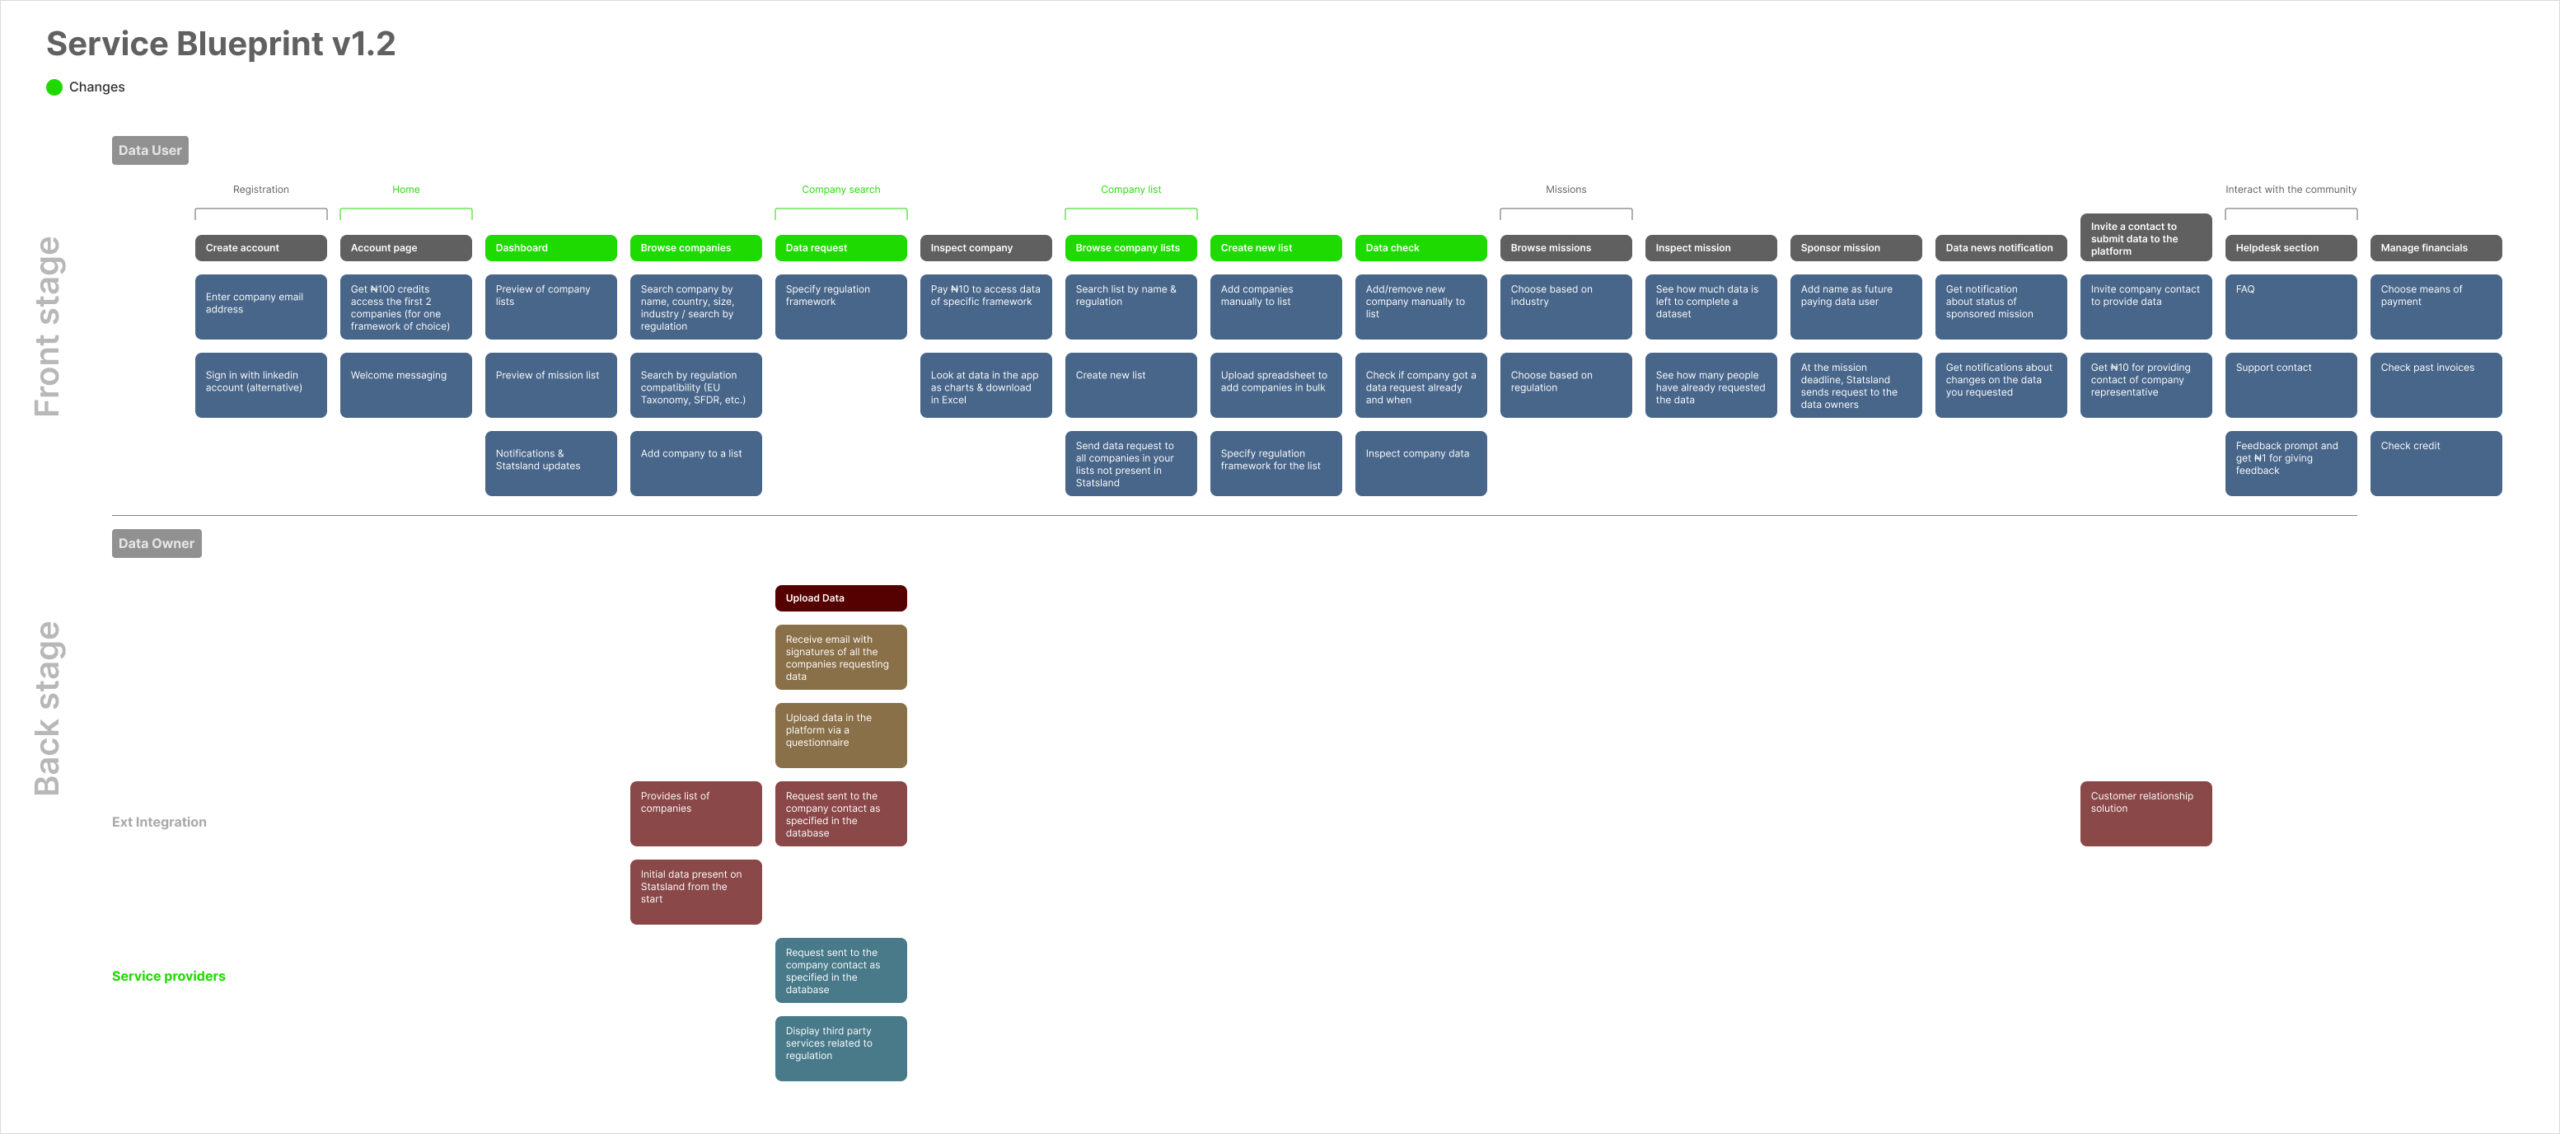
As we learnt more about the scope of the project, the service blueprint was adjusted accordingly. Additionally visualising the different parts of the platform made it easier for skateholders to have discussions on missing parts.
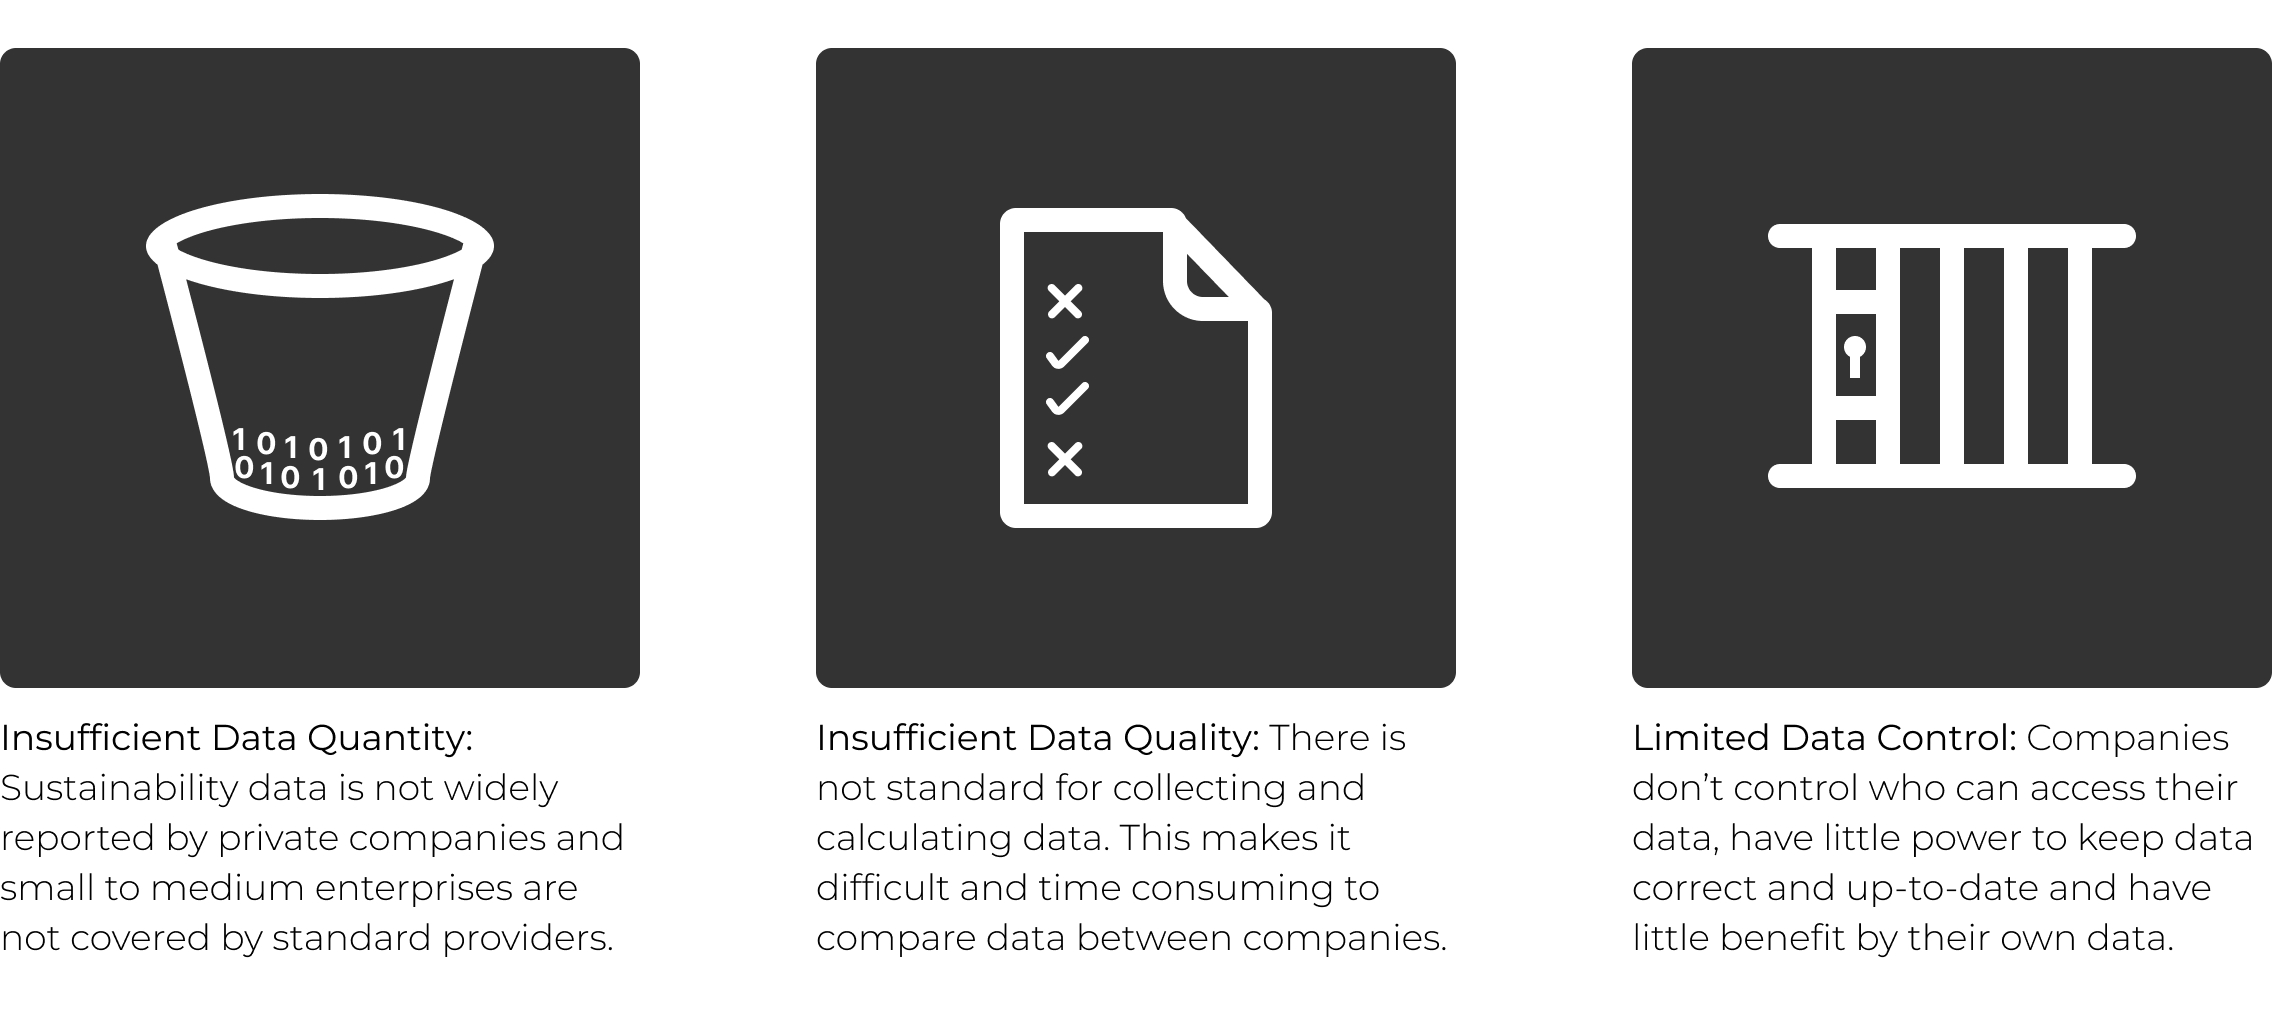
Problems with ESG Data
Introducing Statsland
Statsland is a platform where companies can share their ESG data. Anonymous Data users can verify ESG data of companies and submit corrections creating transparency of data.
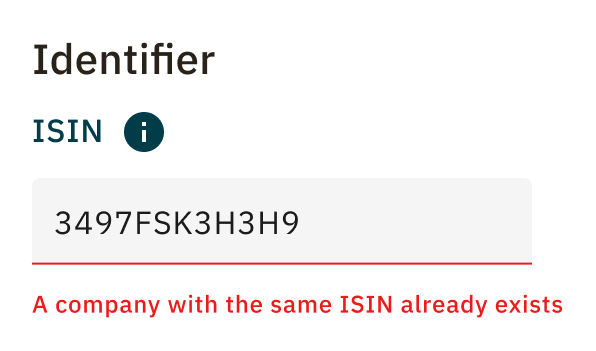
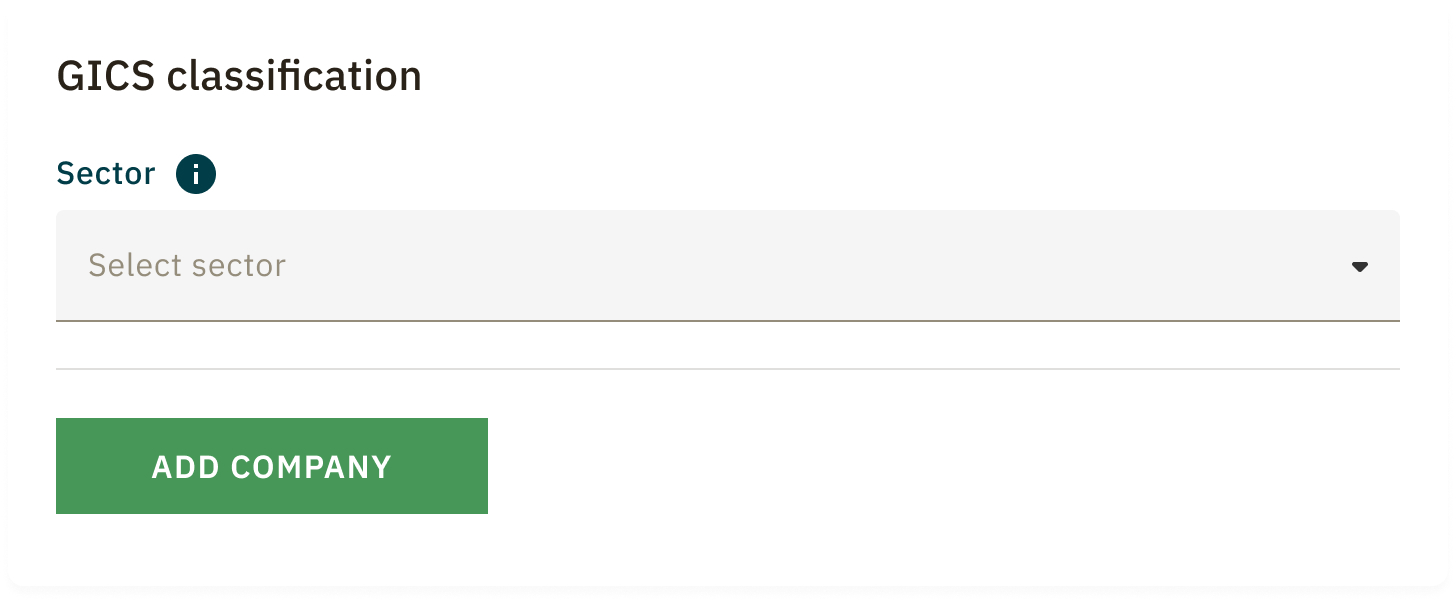
The search of a company
The initial idea of the platform was to serve as database for companies’ ESG data which anyone can view and download as long as they have an account. Therefore getting the search functionality became important.

A humble search bar that can give result for a company by its name or any other unique identifier like perm ID or ISIN.
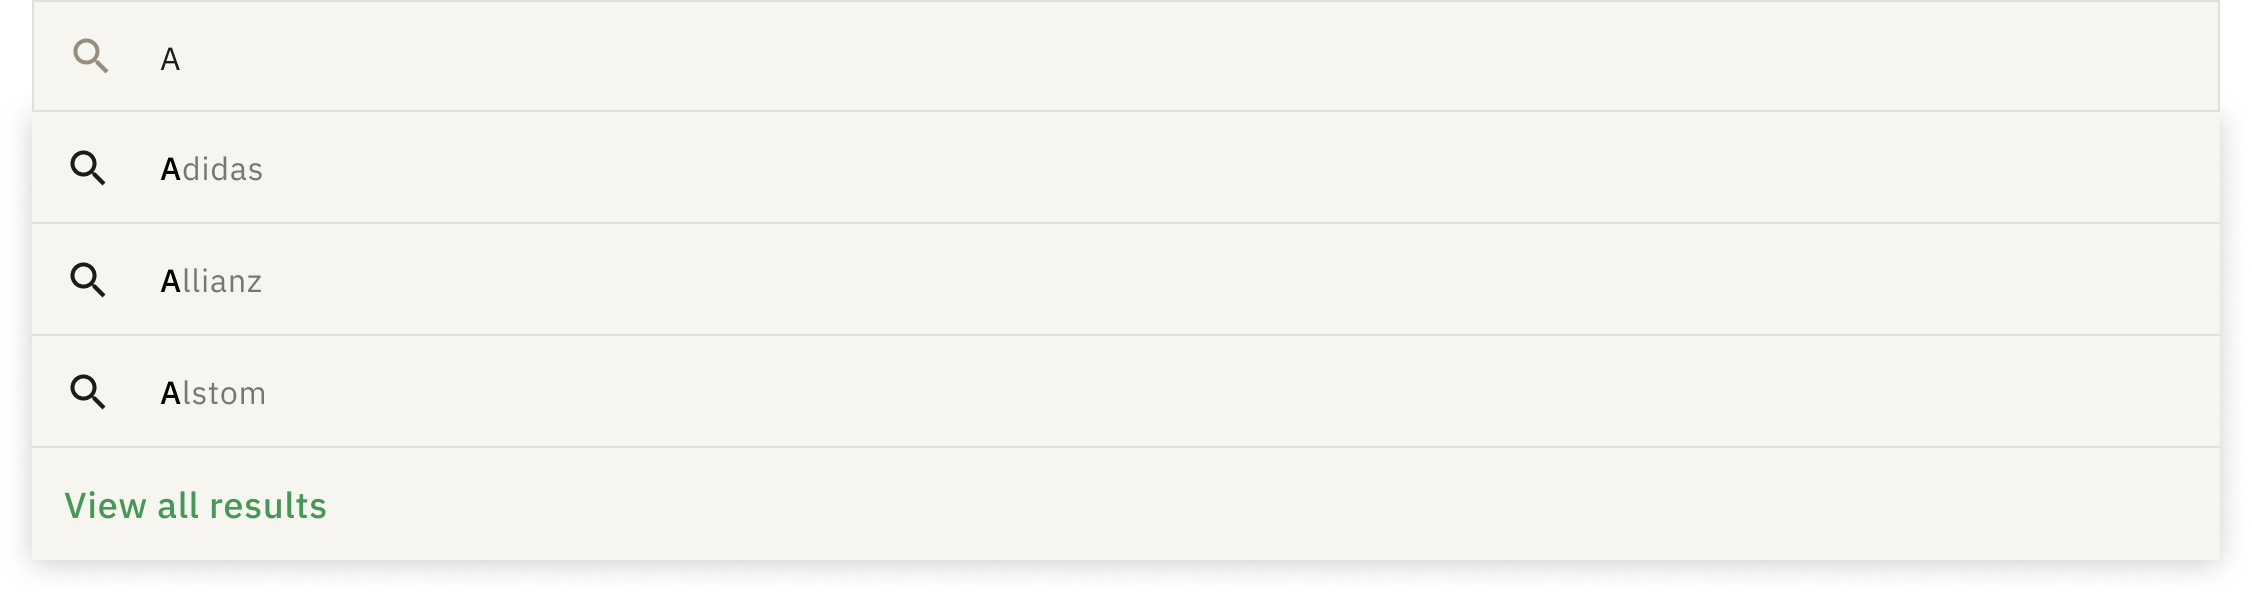
I proposed a typeahead search for the company results as soon as an alphabet is typed. A user can select the company in three ways:
- They can select the company from the recommended list or
- They can hit enter to see all the companies starting with ‘A’ or
- They can click ‘View all results’ to see all the company names with ‘A’.
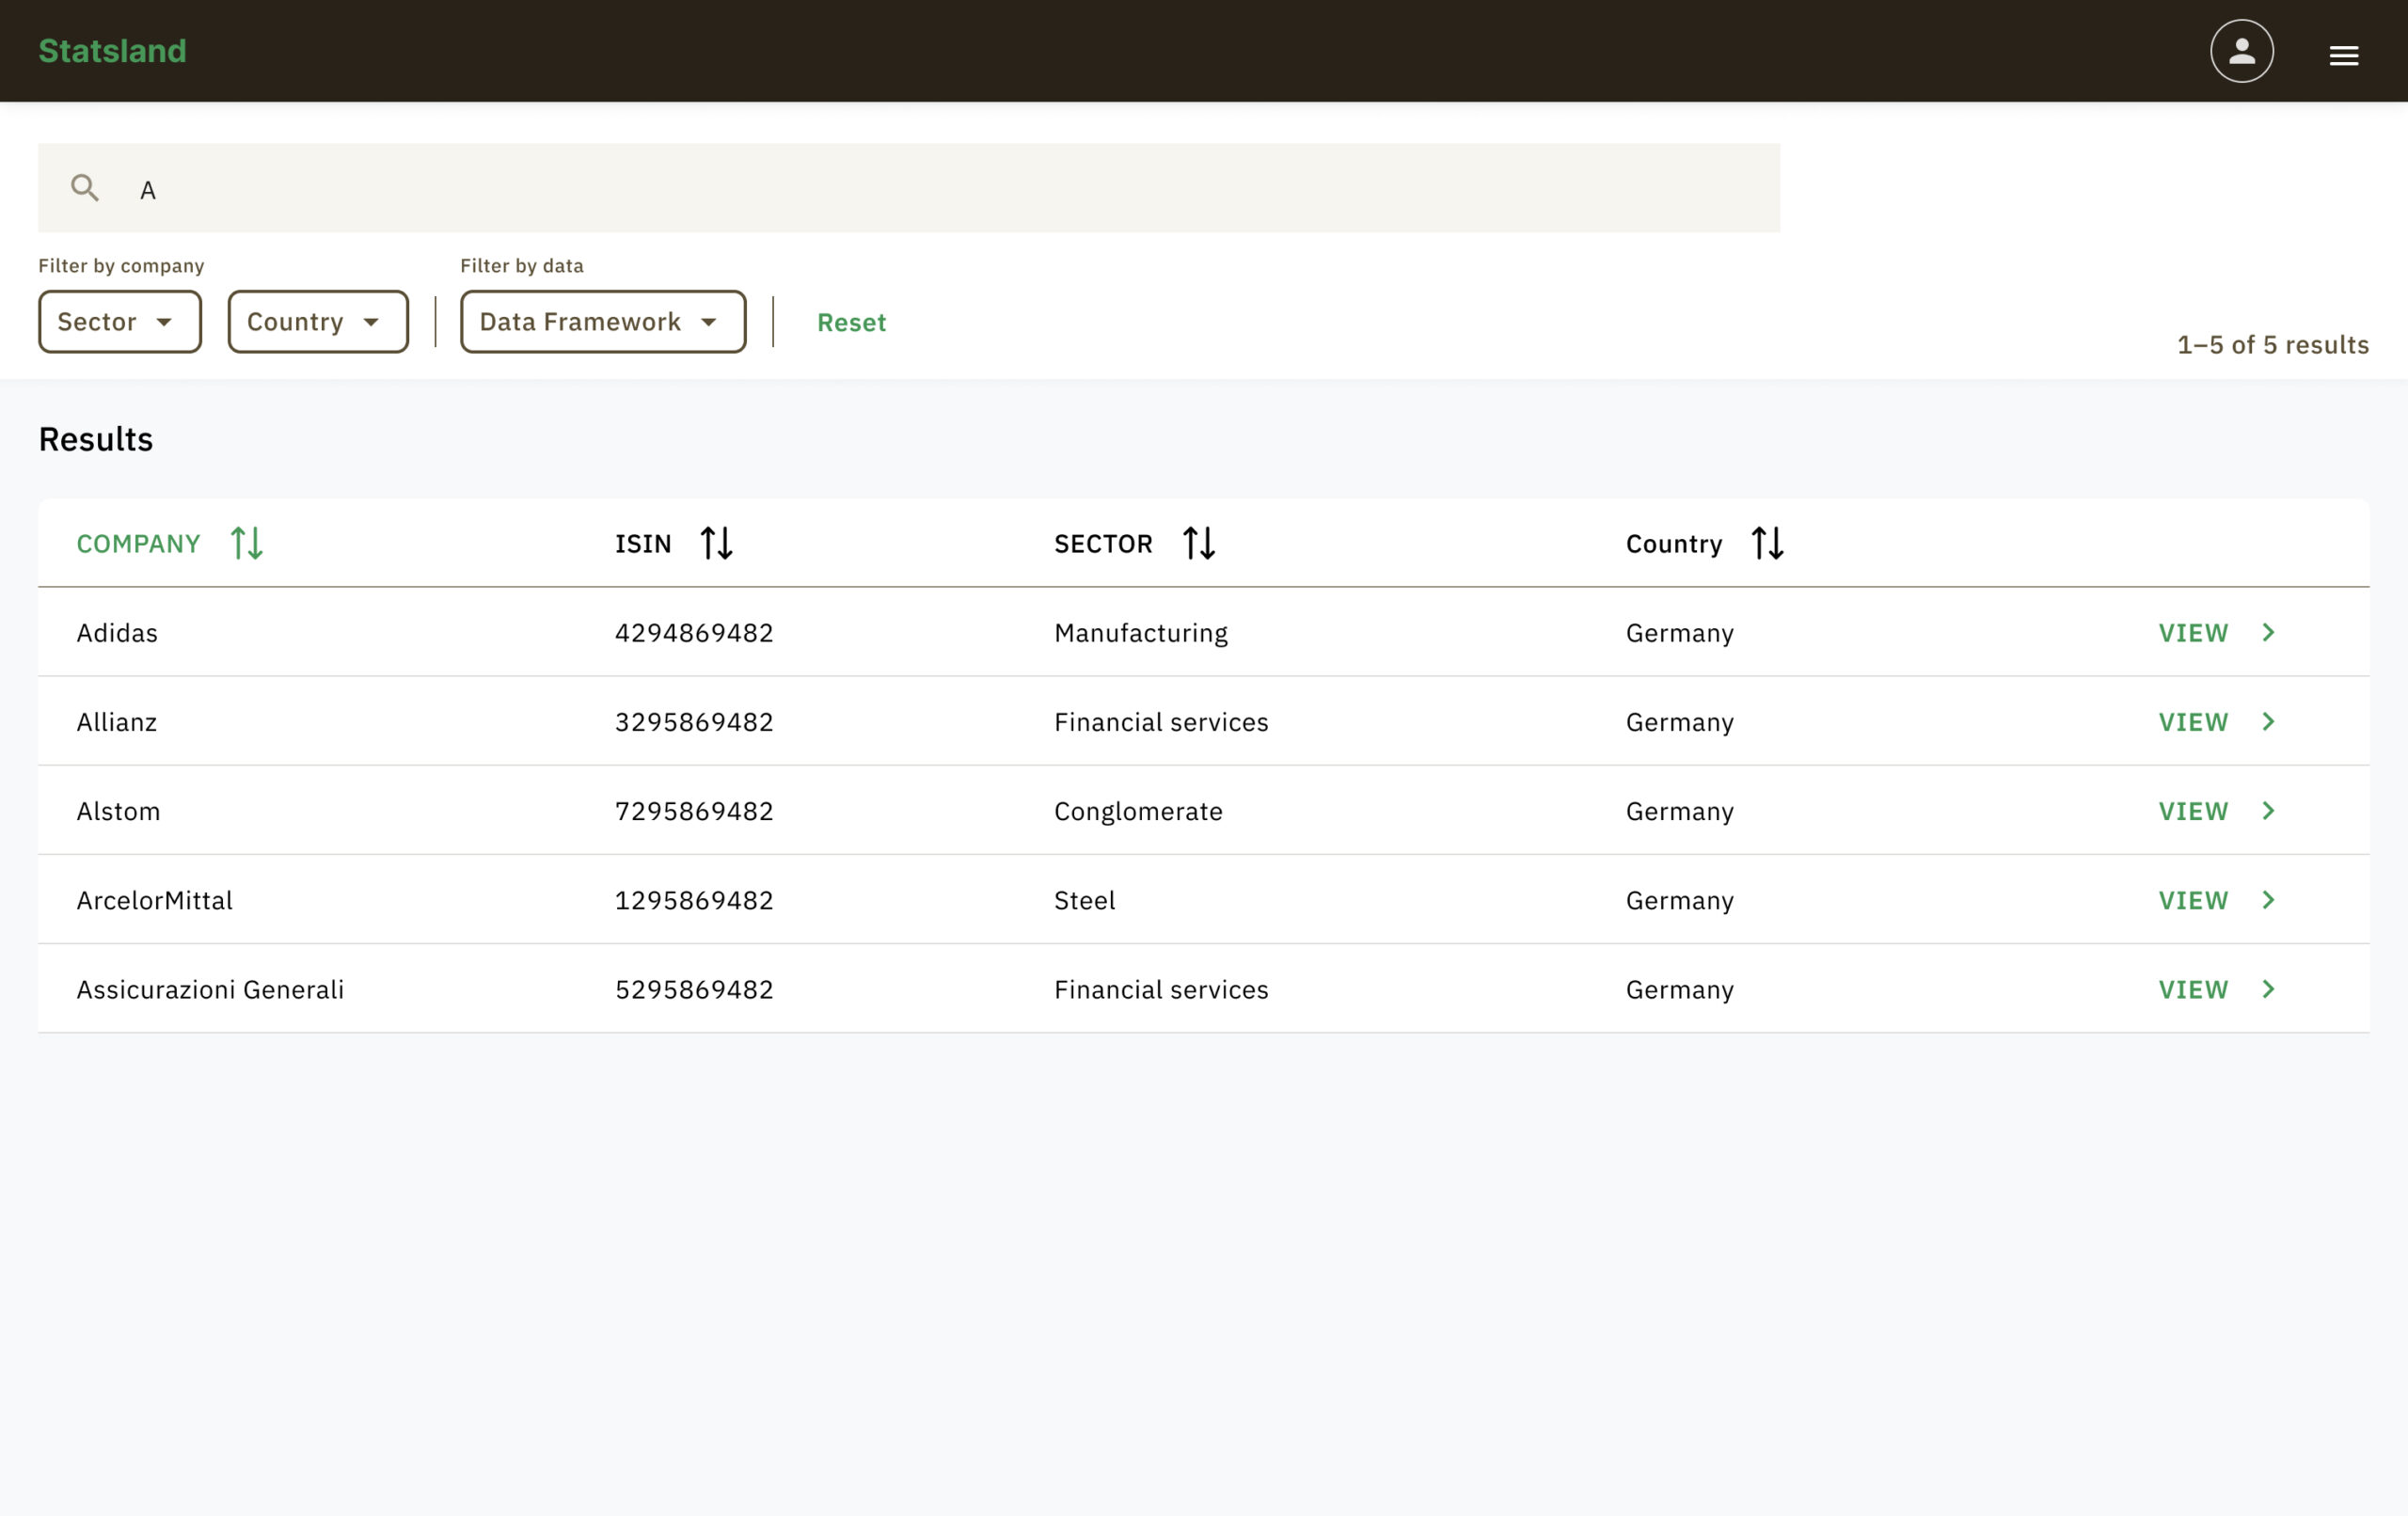
When a user press ‘enter’ or clicks ‘View all results’, the result with company names starting with ‘A’ is shown.
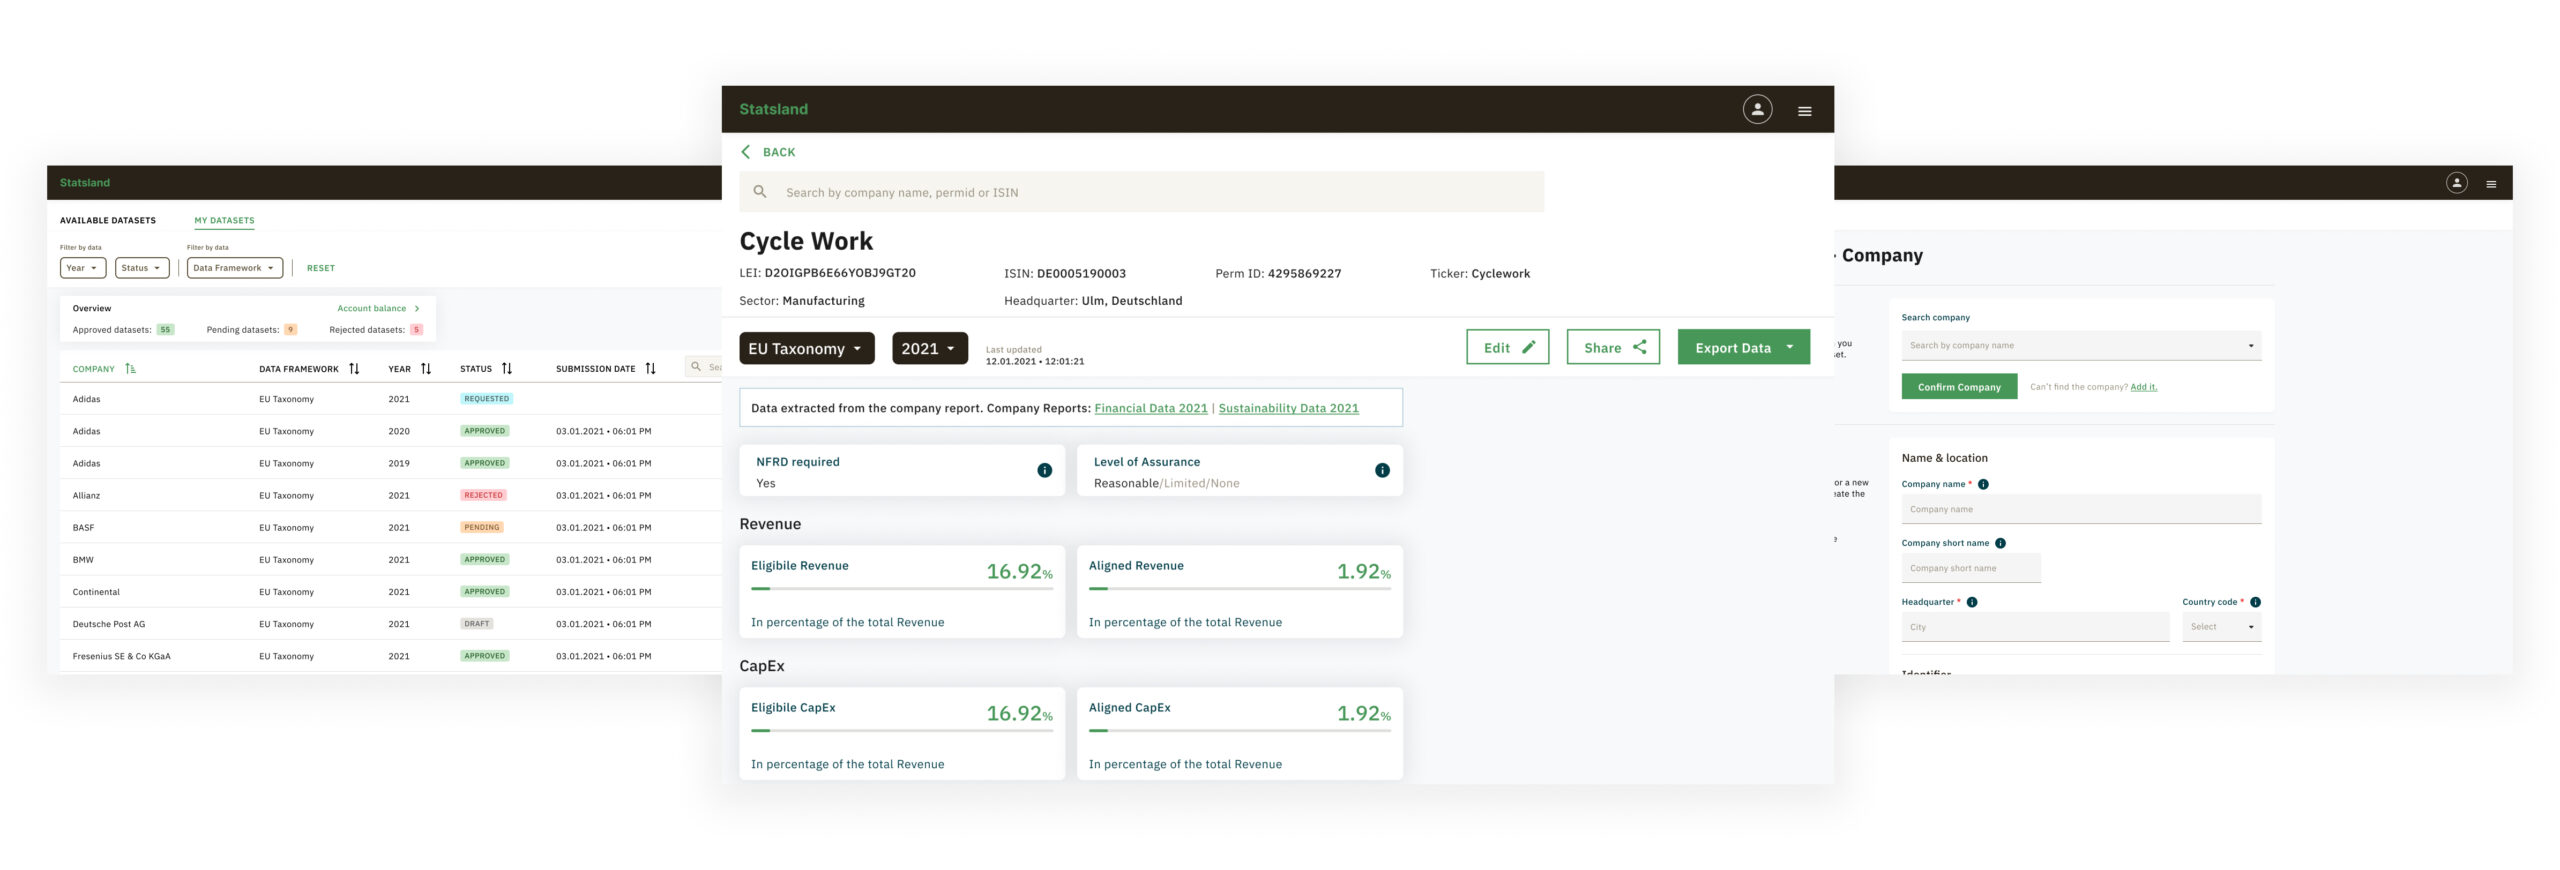
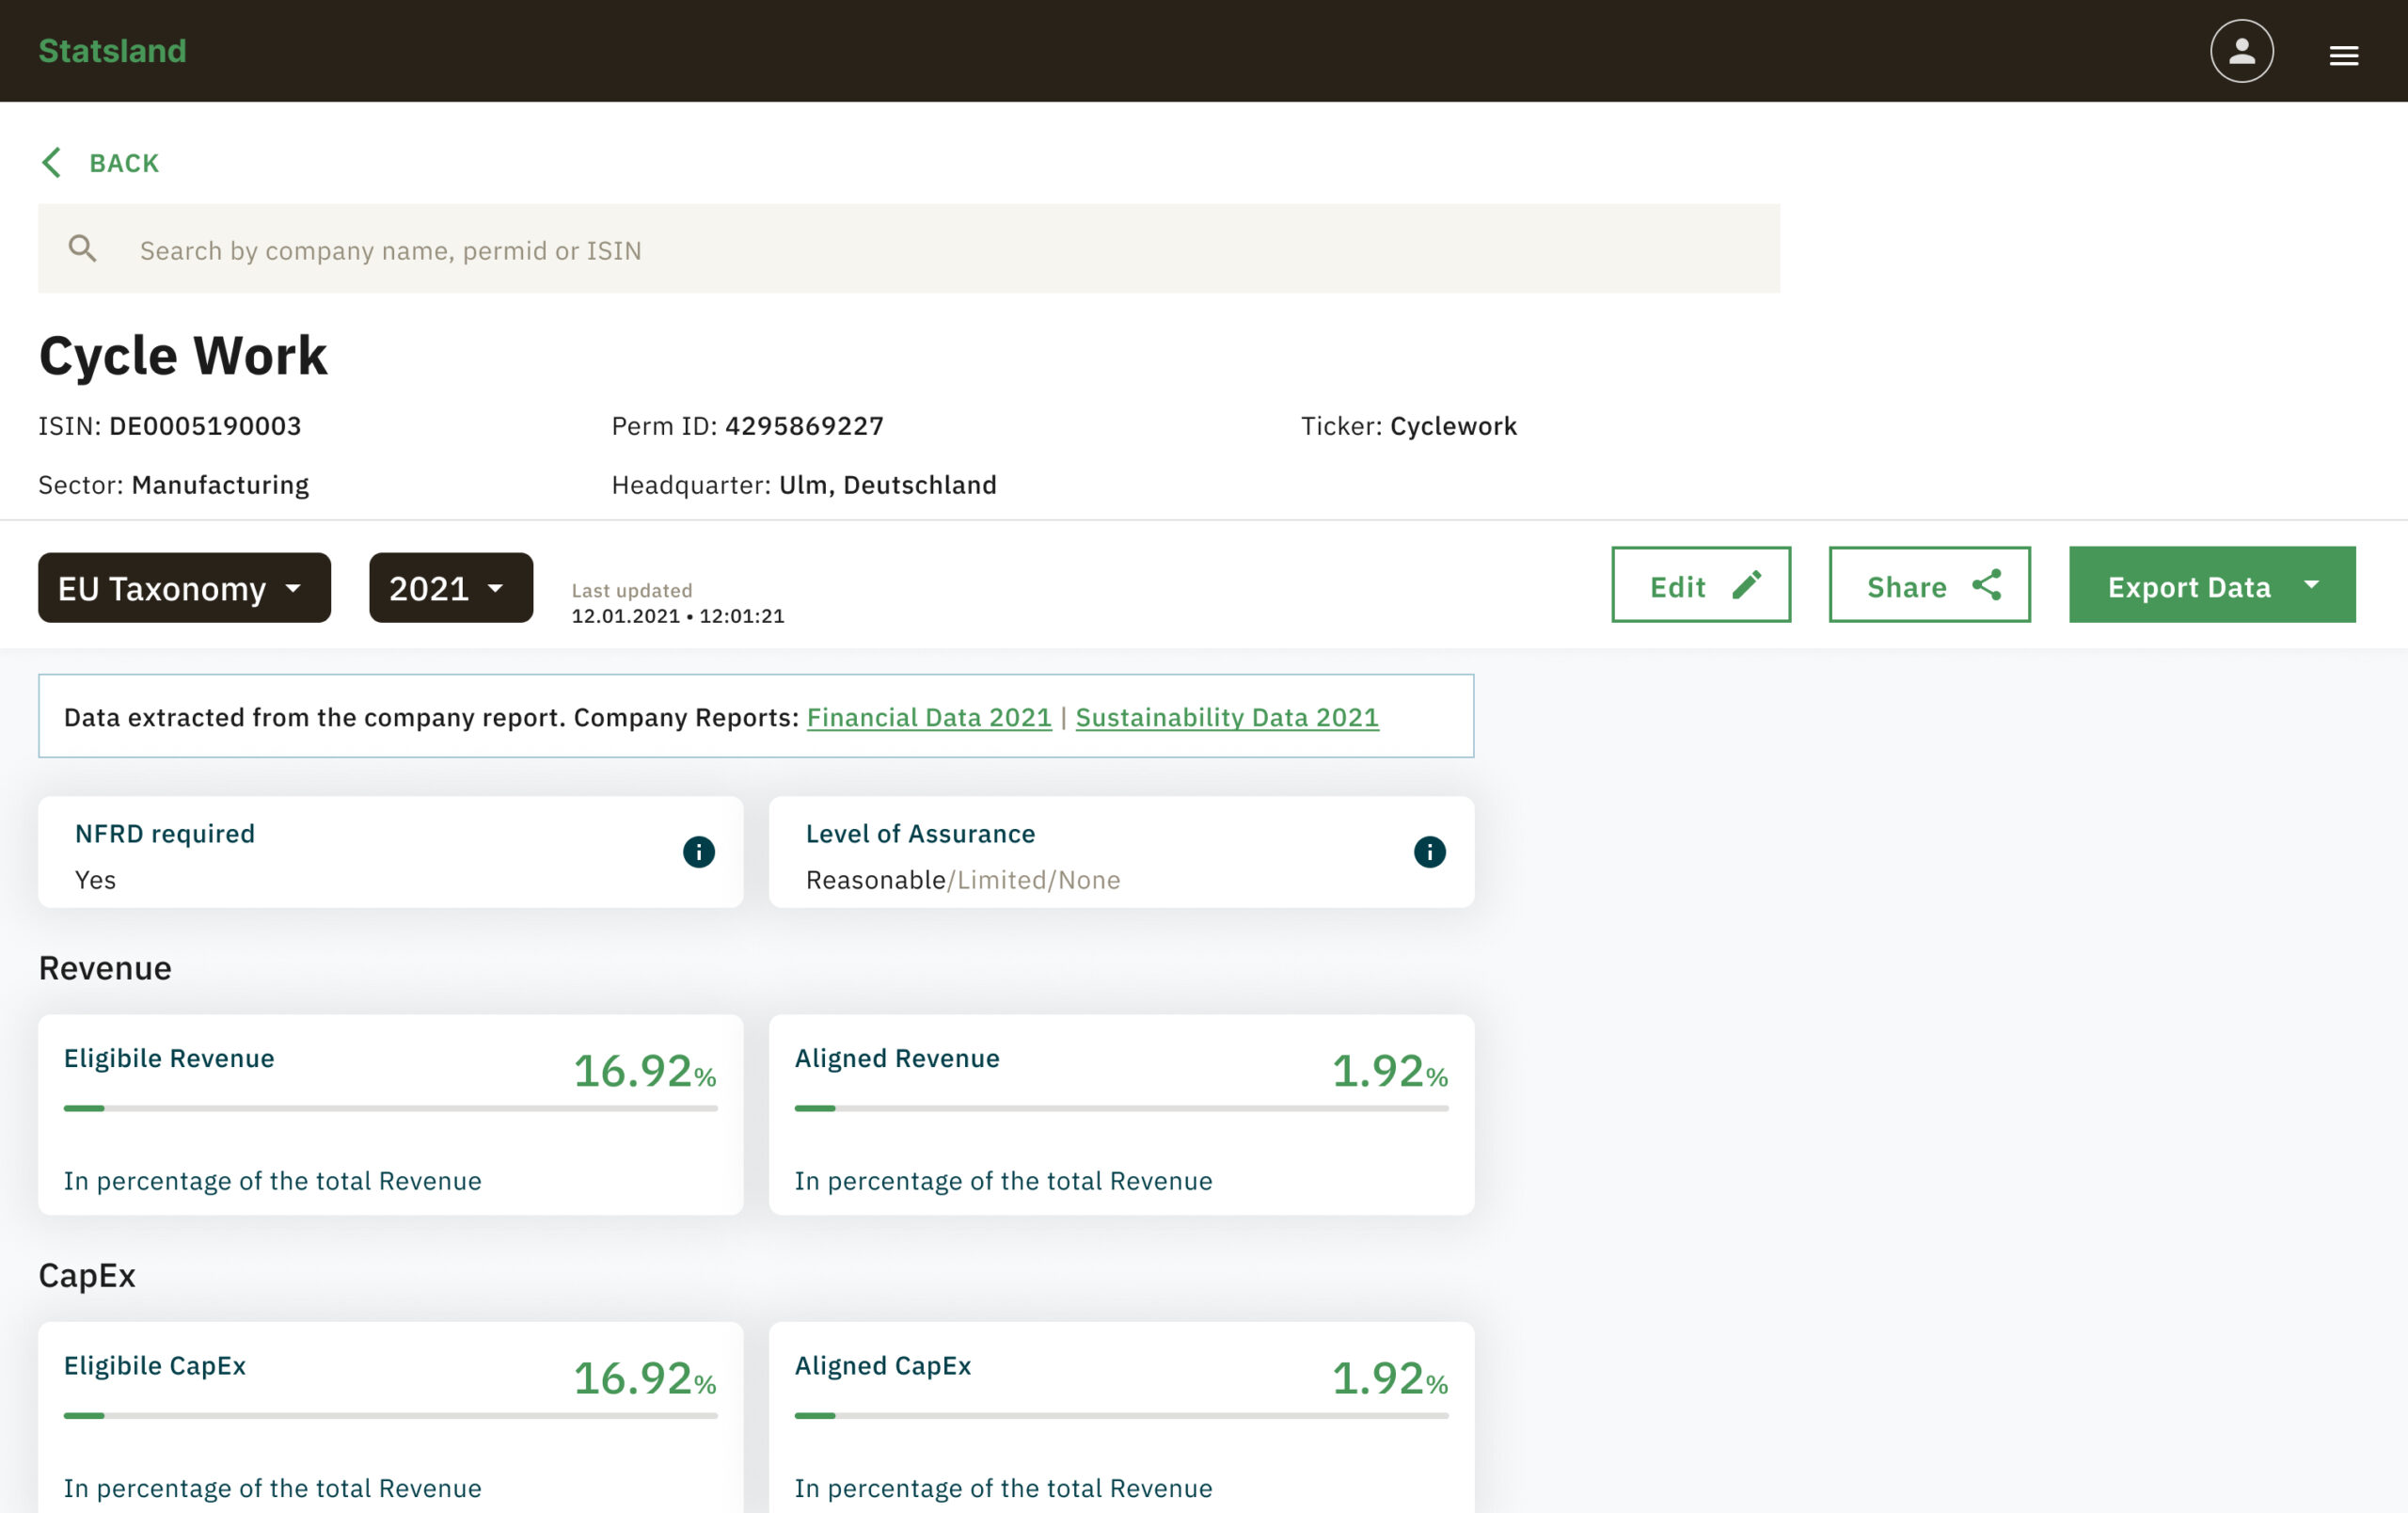
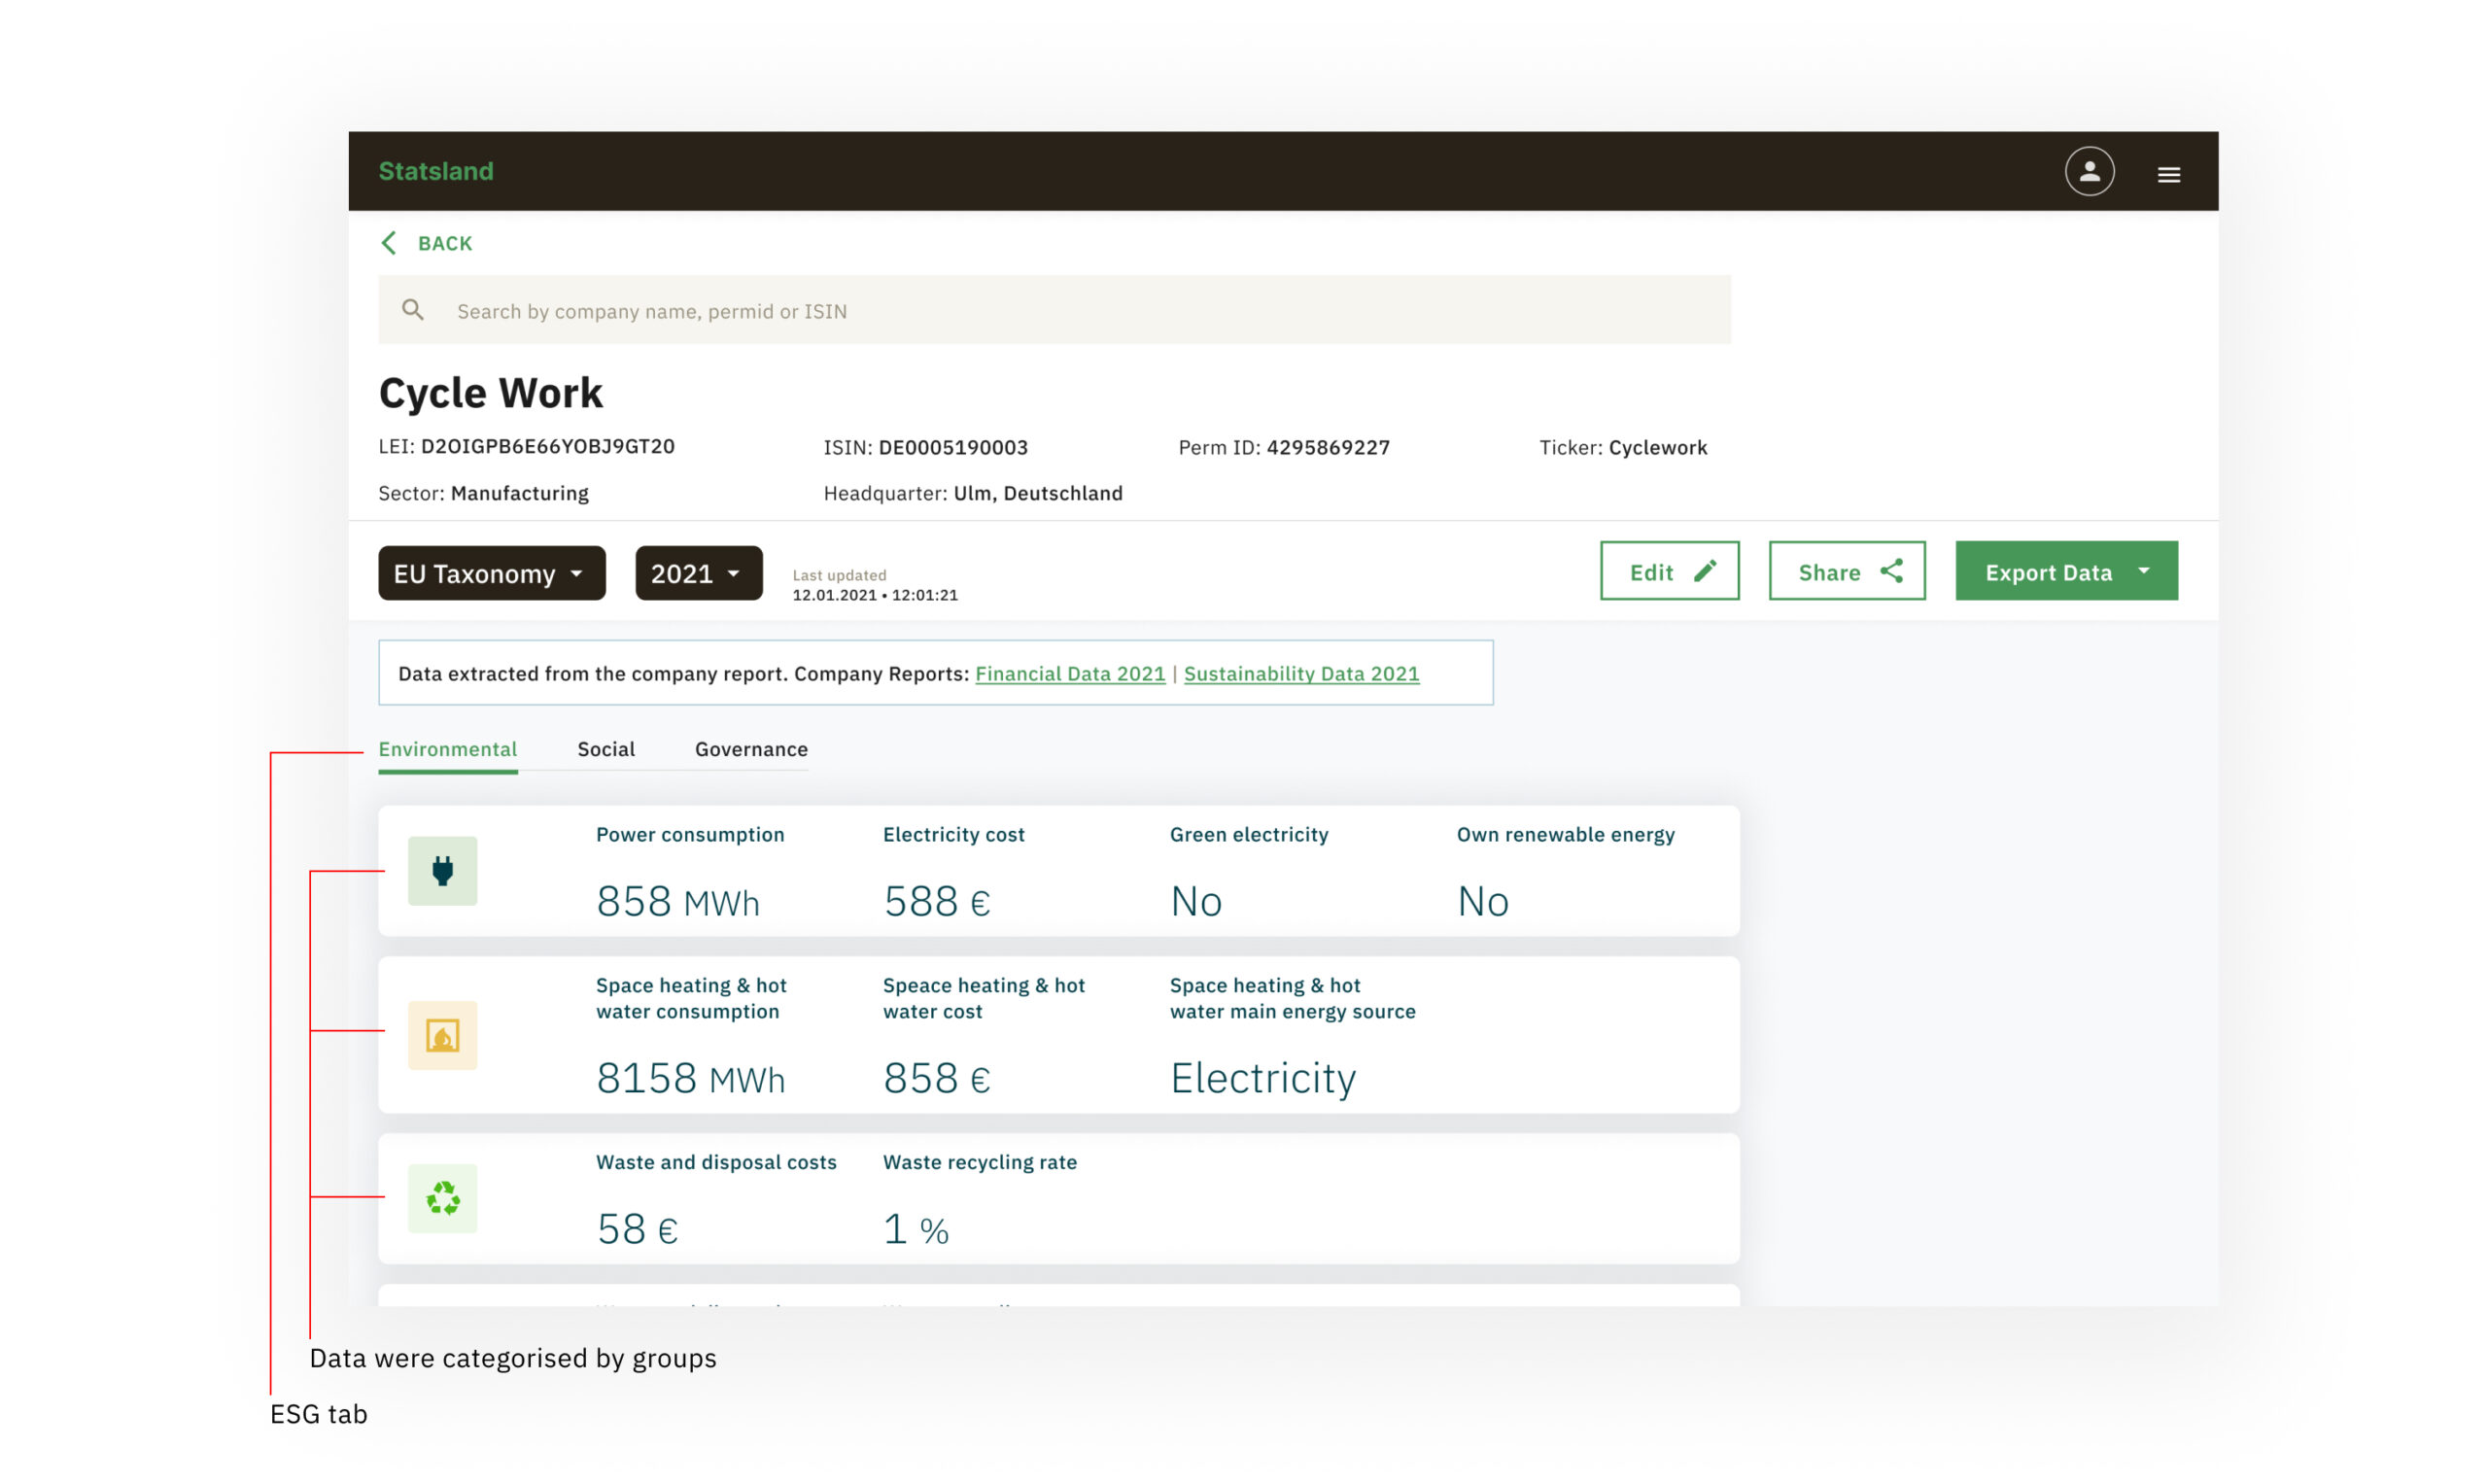
The company page
The amount of data of a company can be overwhelming. While the information of a specific company are important for identification as companies can have the same name for different subsidiaries, the identification data are of no use after you have recognised the correct company. The ESG data of the company becomes more important and therefore the collapse behaviour provides more real-state on the screen.
The right amount of hierarchy
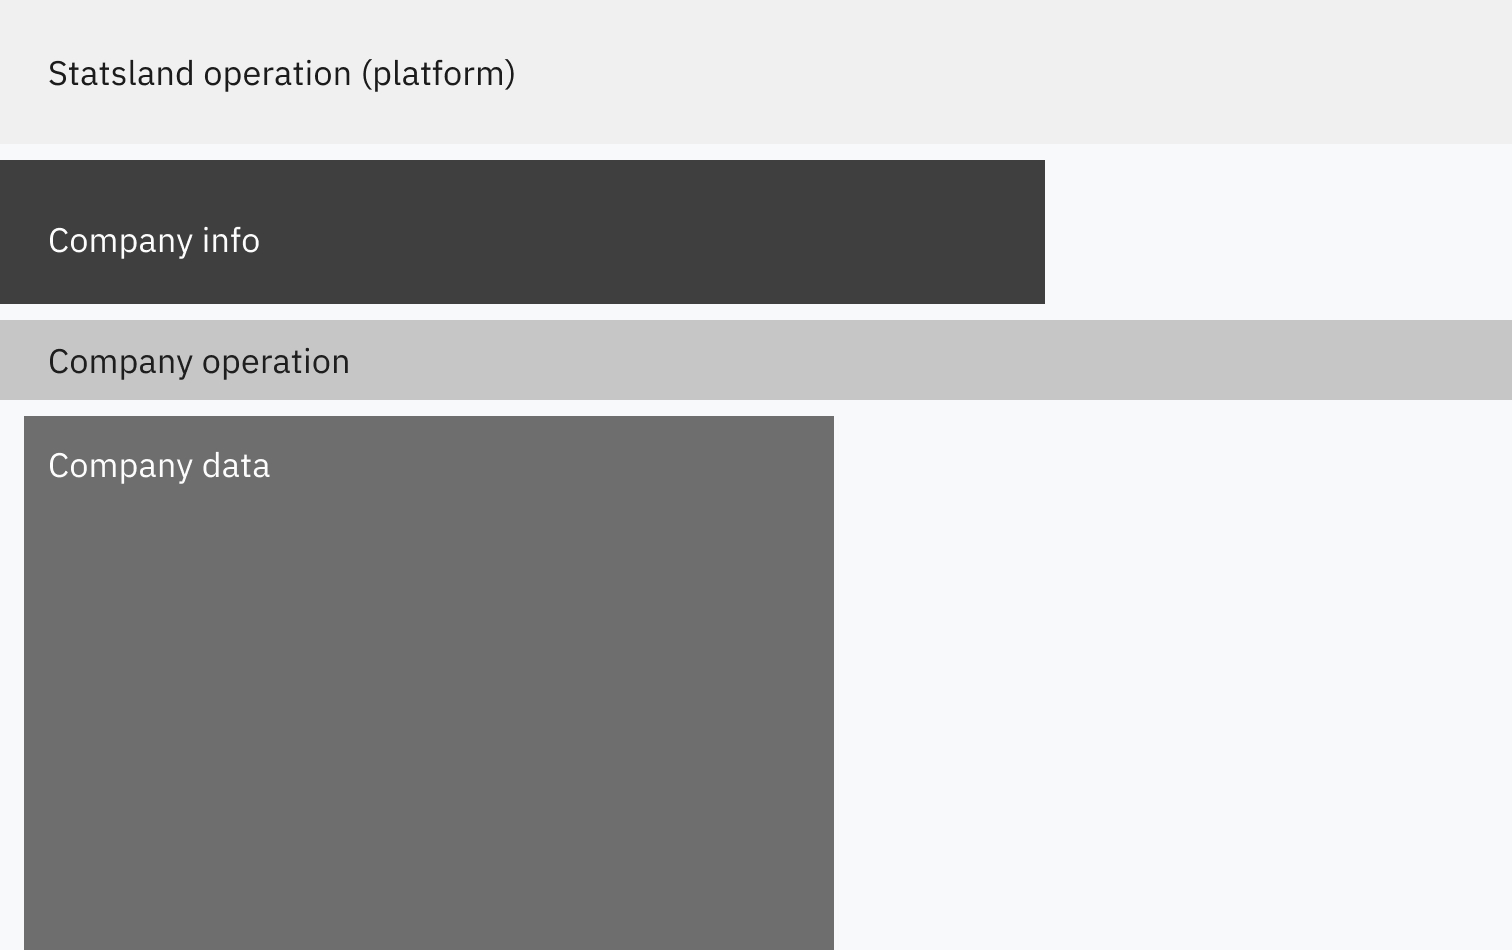
Importance of info on the page:
1. Company info 2. Company data 3. Company operation 4. Statsland operation
The company details page with company's identifiers being the most important.
The transition of hierarchy
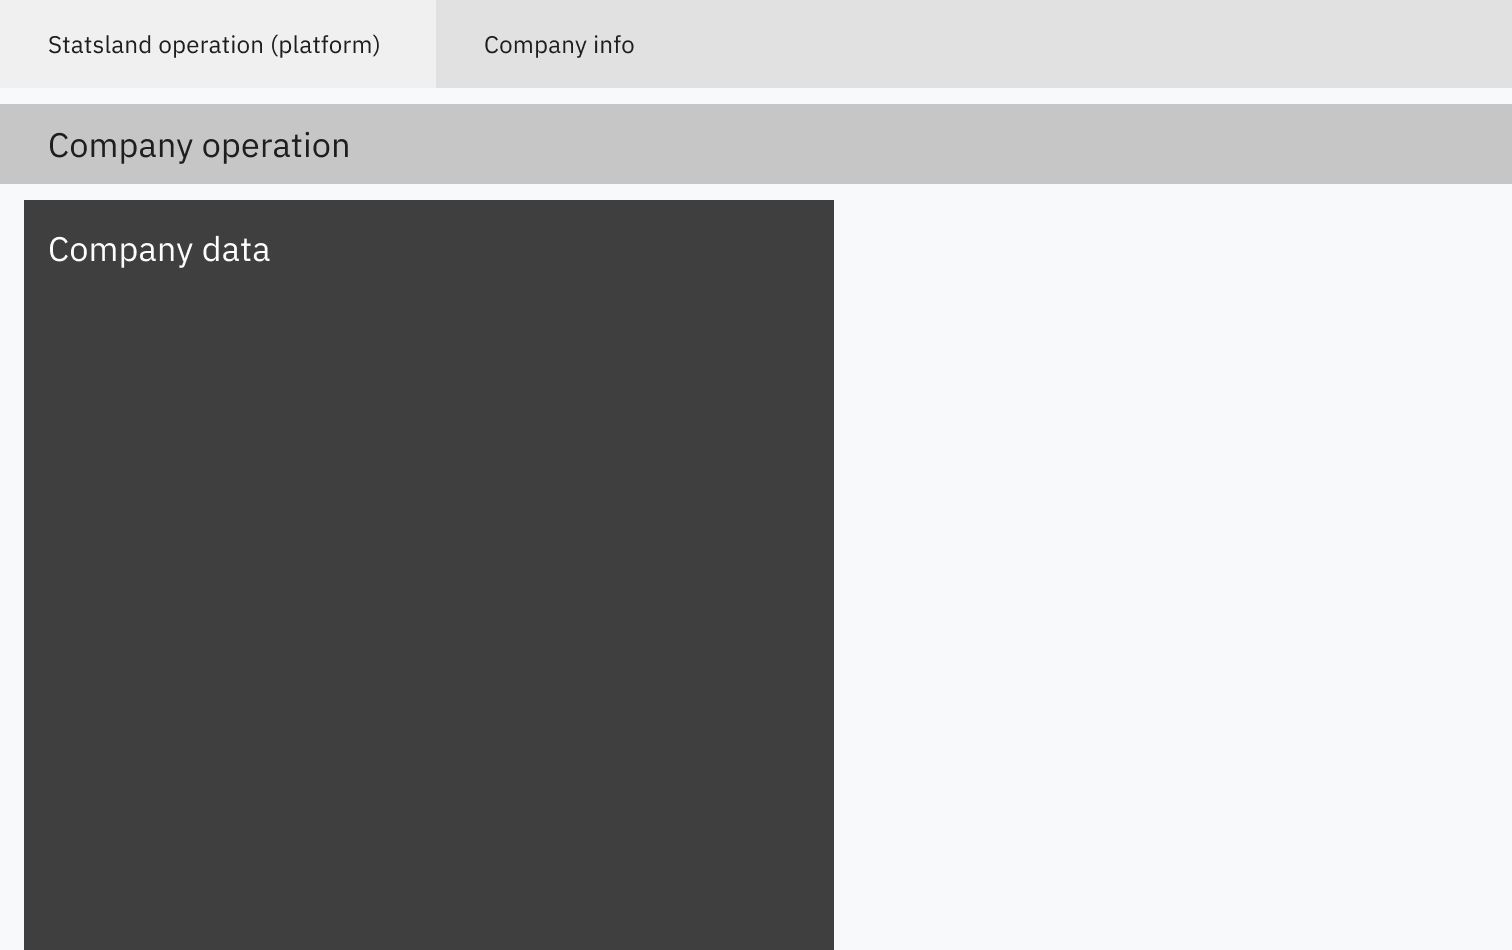
Change of importance in info on the page upon scrolling:
1. Company data 2. Company operation 3. Company info 4. Statsland operation
Company's data is more important if a user scrolls.
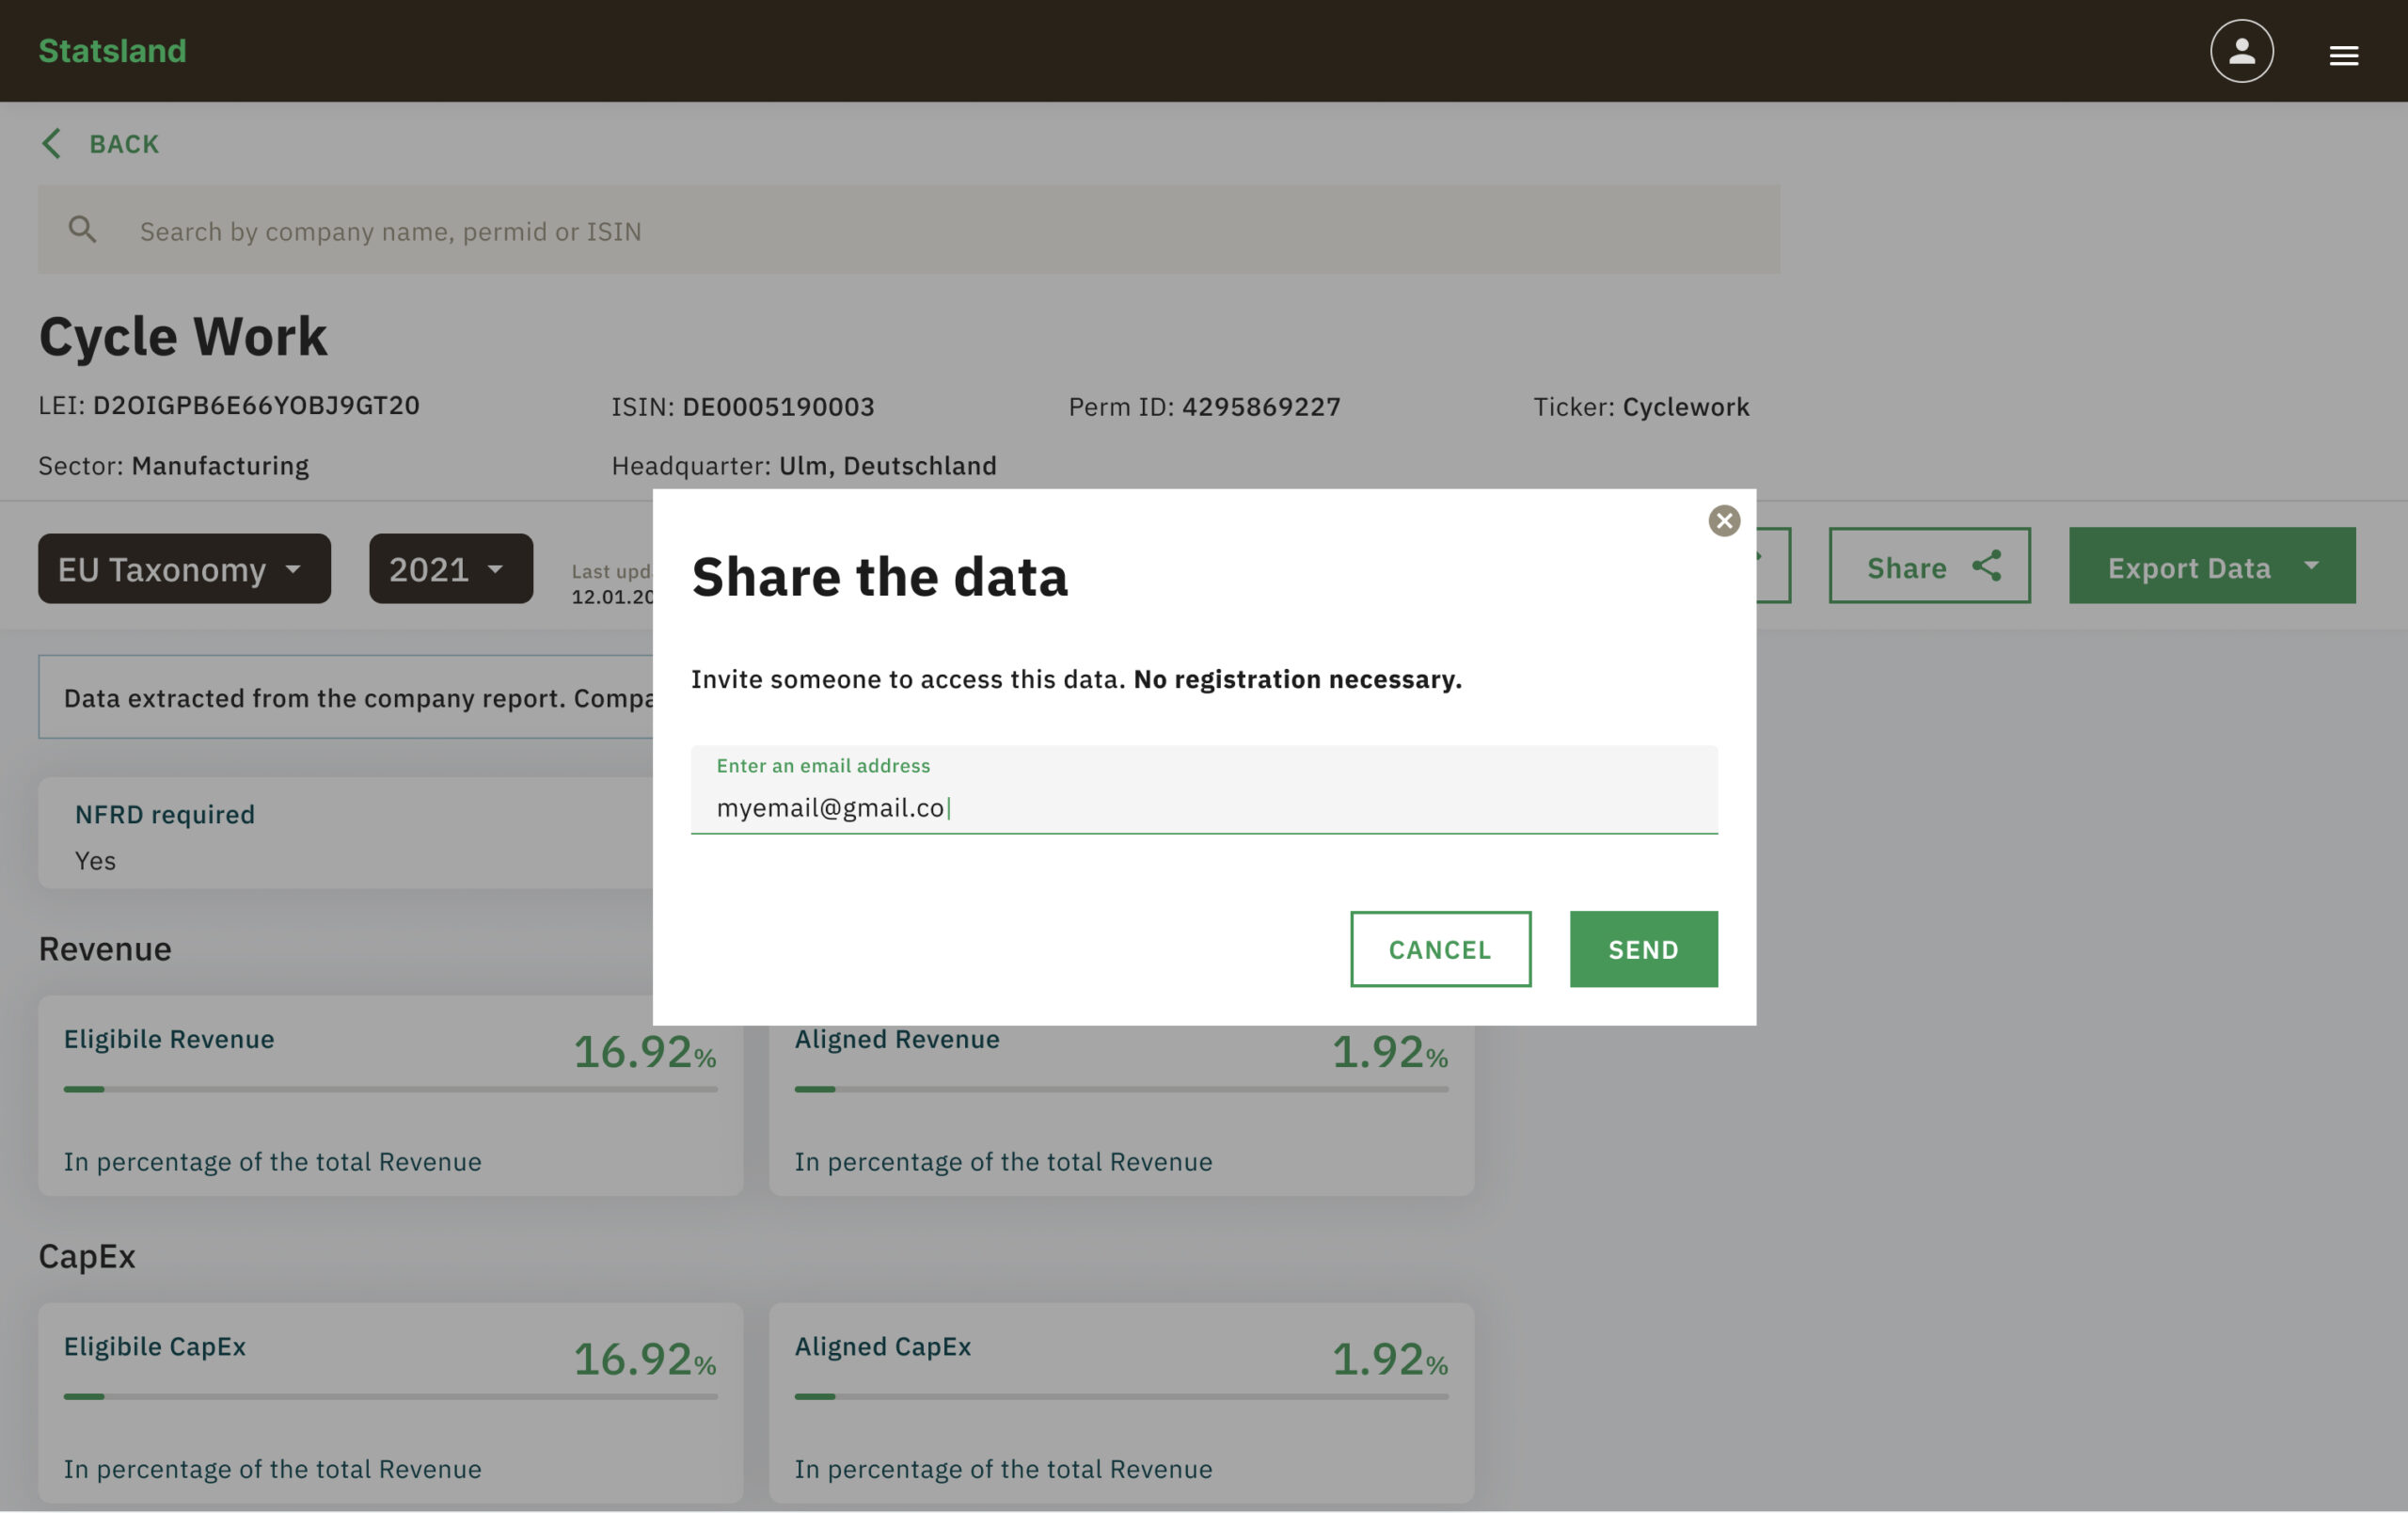
The download of the report
The report of a company can used in two ways. It can used for data correction if any error is found or it can used to circulate within your team or for comparison. We ensured that export of data can happen in the formats that can be easily consumed and therefore options to email the report, download it as CSV and PDF were made available.

It was crucial to have a snackbar with the download completion info as a user can goto another part of the platform.
This micro-interaction didn't make it to the final design due to backlogs and time-constraints.
How does ESG data get uploaded
The challenge
Data collection and upload was done by one data provider (another org dedicated for the work), who fill their data through excel spreadsheets based on our template. Which is then checked manually by us and then provided as a file to our engineers. But this is slow and error prone and doesn't scale for multiple data providers.
Our approach
We introduced a process where data providers can autonomously upload their data on Statsland and Statsland checks the data in the background for quality assurance. Thereafter the data is then available on Statsland. We focussed on the simplest process to achieve the data upload. We proposed one single account for data providers (as opposed to a corporate account with multiple users) and in the minimum number of interface. This made the insertion of data easier, and increased the data available on Statsland.
Thinking through prototypes philosophy
I made initial wireframes to check I understand the workflow well and if it covers the use cases. I got a round of feedback that helped me to refine them for the next version.
Co-creation
To learn more, we refined the low-fi prototypes to co-create with the data providers and collect feedback that guided us to come up with designs that aligned with what would become final designs for upload.
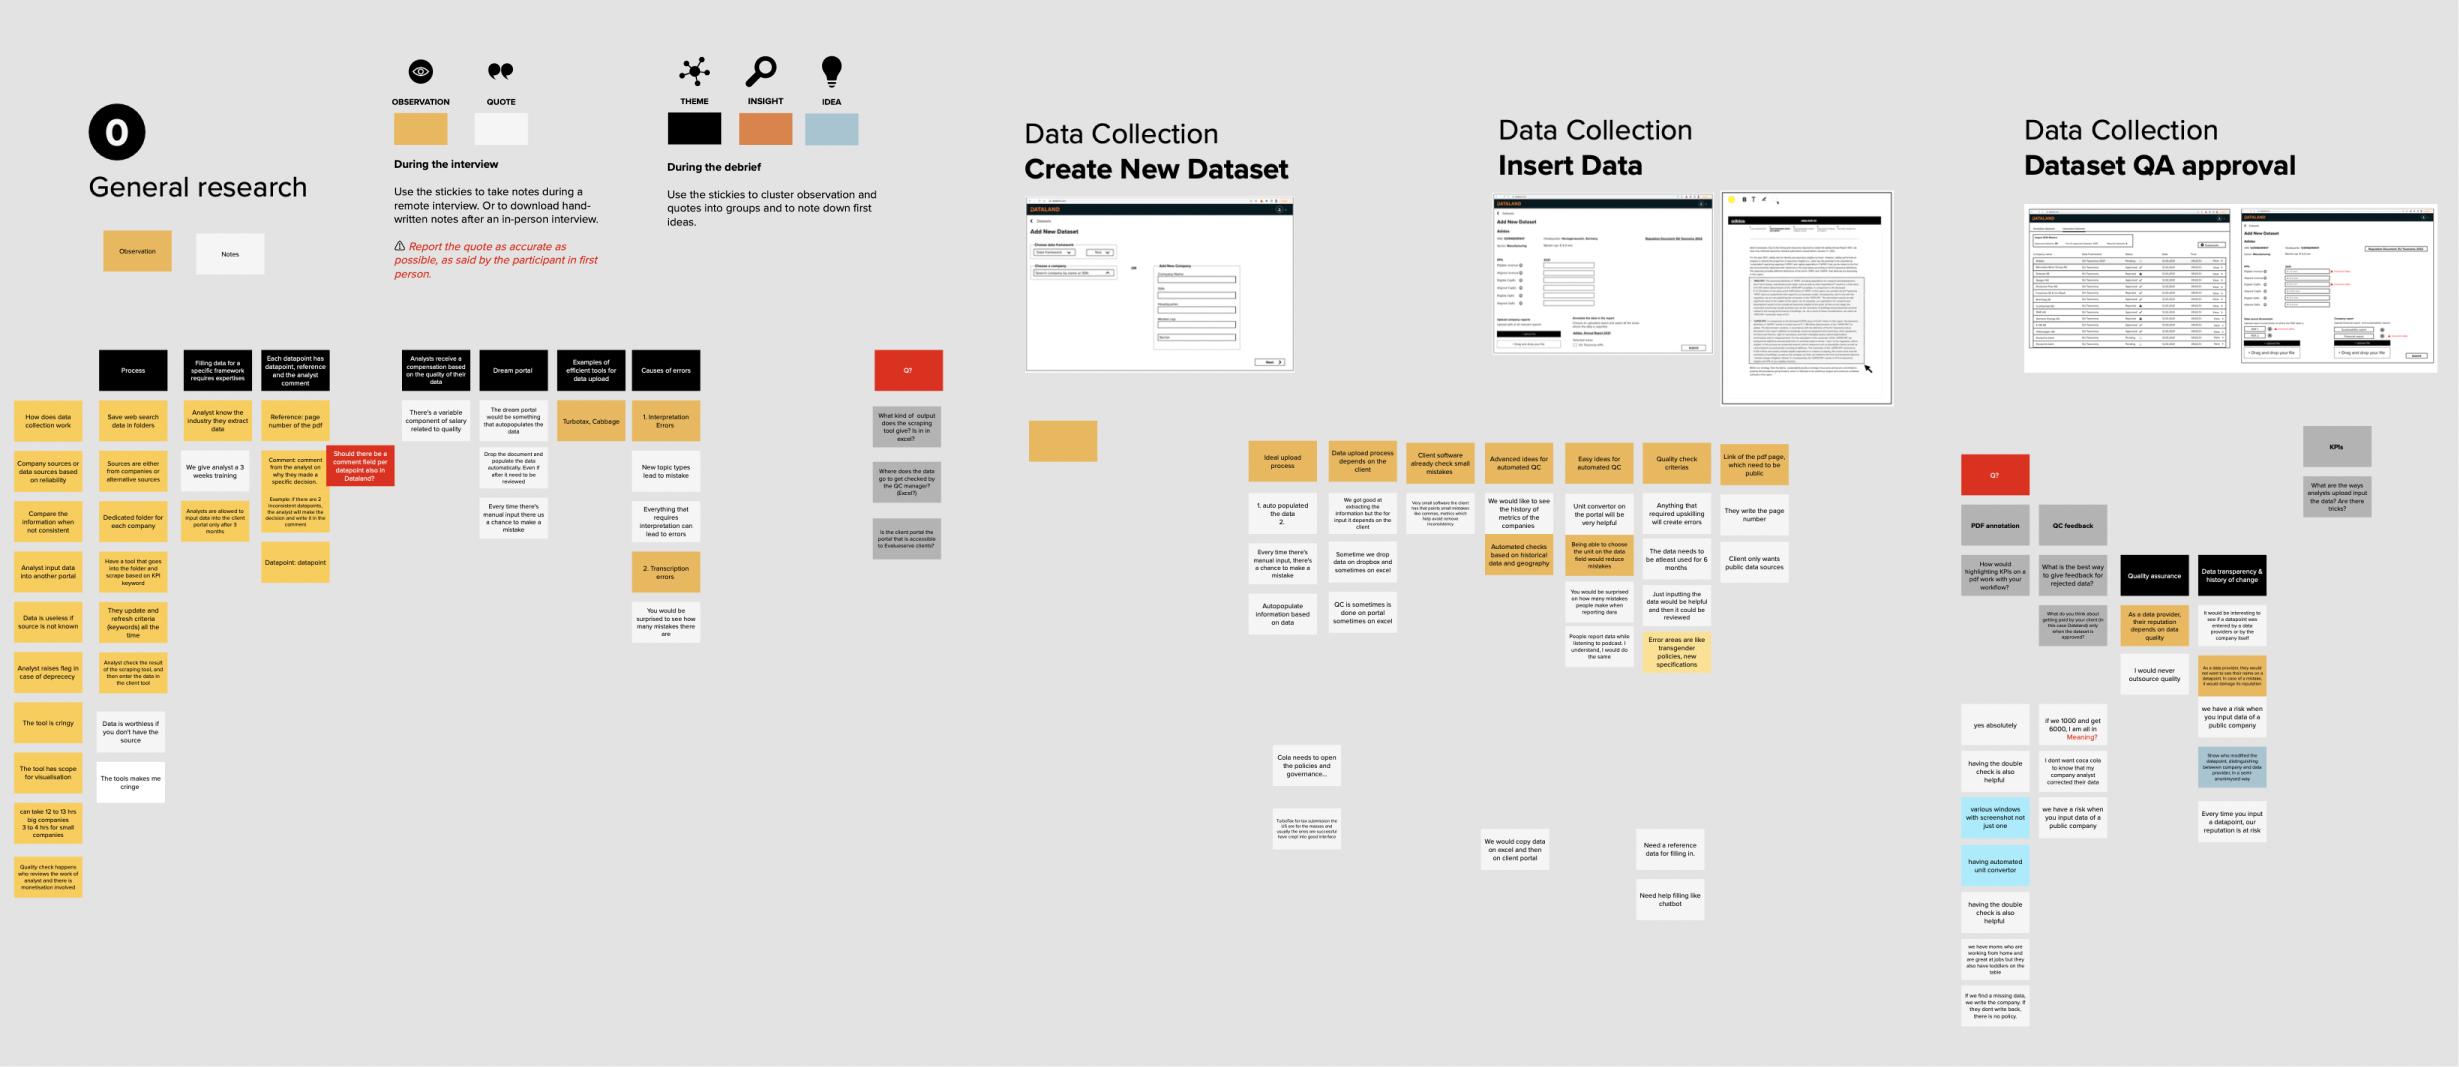
The findings
After synthesising our findings, we got some insights and shared them with our team members to get their buy-in. This artefact became a crucial piece for discussion helped us prioritise certain use cases over others. The discussion also led to feedbacks which were incorporated into the final designs. Broadly the feedback touched upon three factors:
- Low-error data input
- Automation and guidance
- Authoring
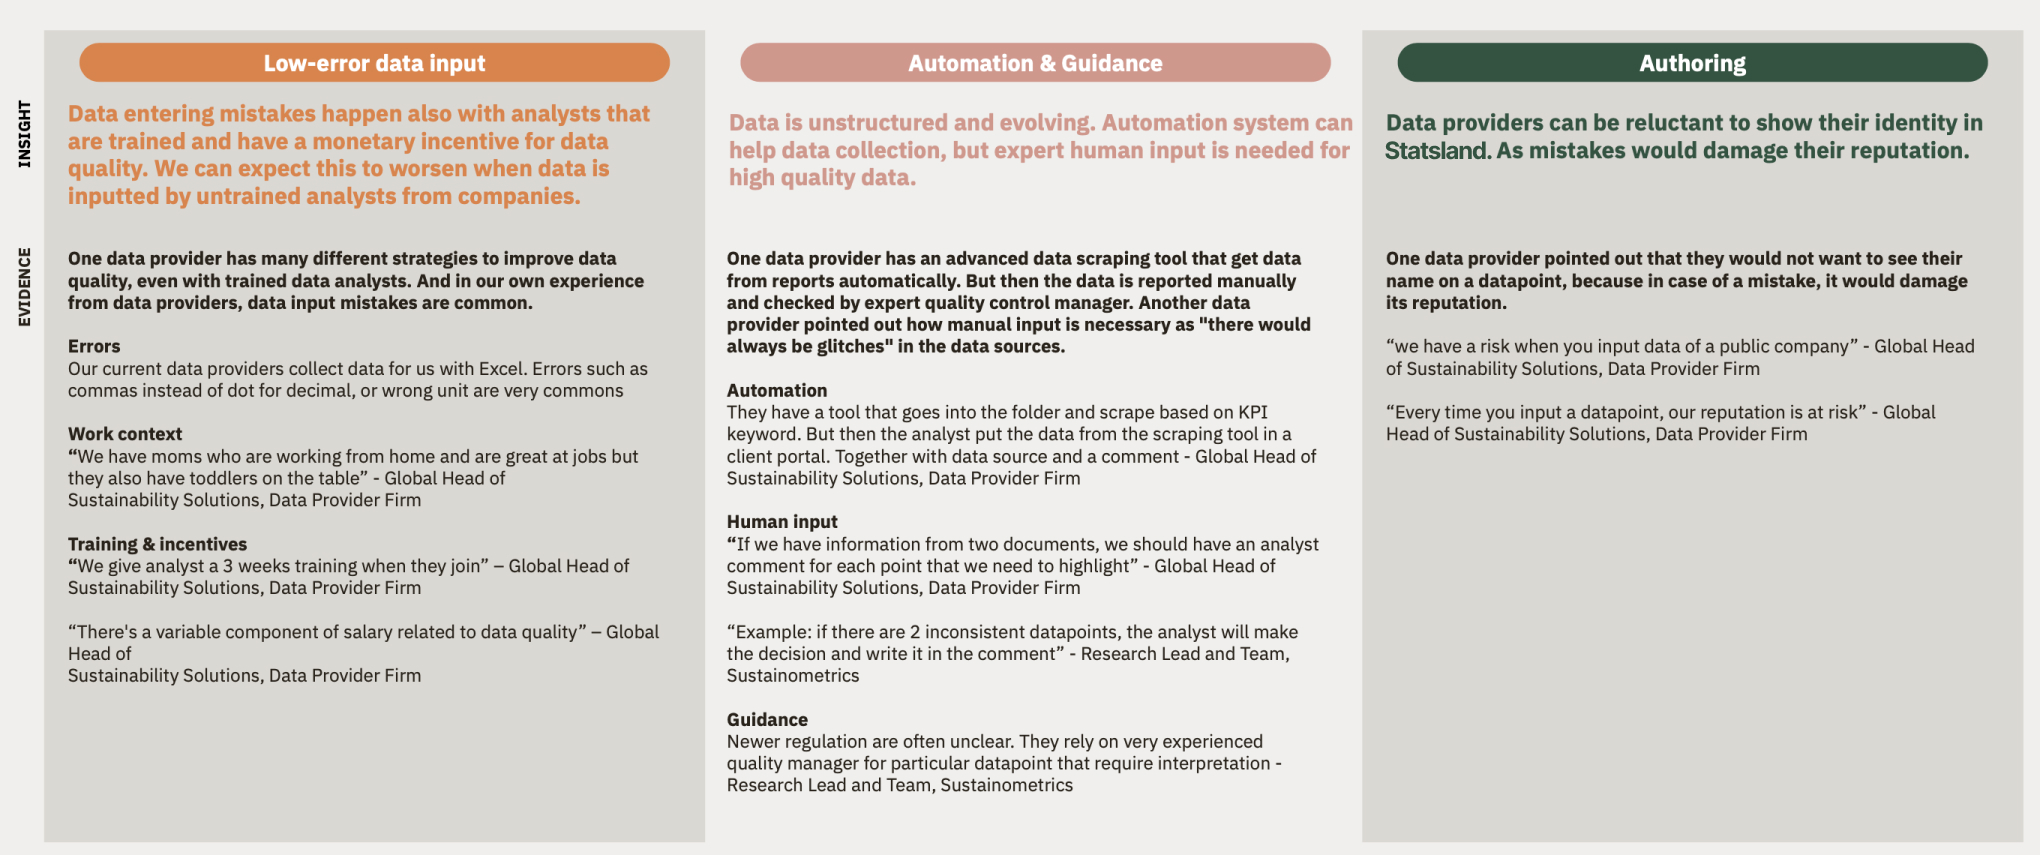
The findings were broadly divided into three categories shown in the image.
An insight
Data providers can be reluctant to show their identity in Statsland. As mistakes would damage their reputation.
The recommendations
With each category that were found during research, we made recommendations on how they can tackled. The solutions were prioritised based on the number of the users who pointed at the problem or if the problem would create a roadblock further down the line. They were discussed further within the team based on development feasibility and product goals.
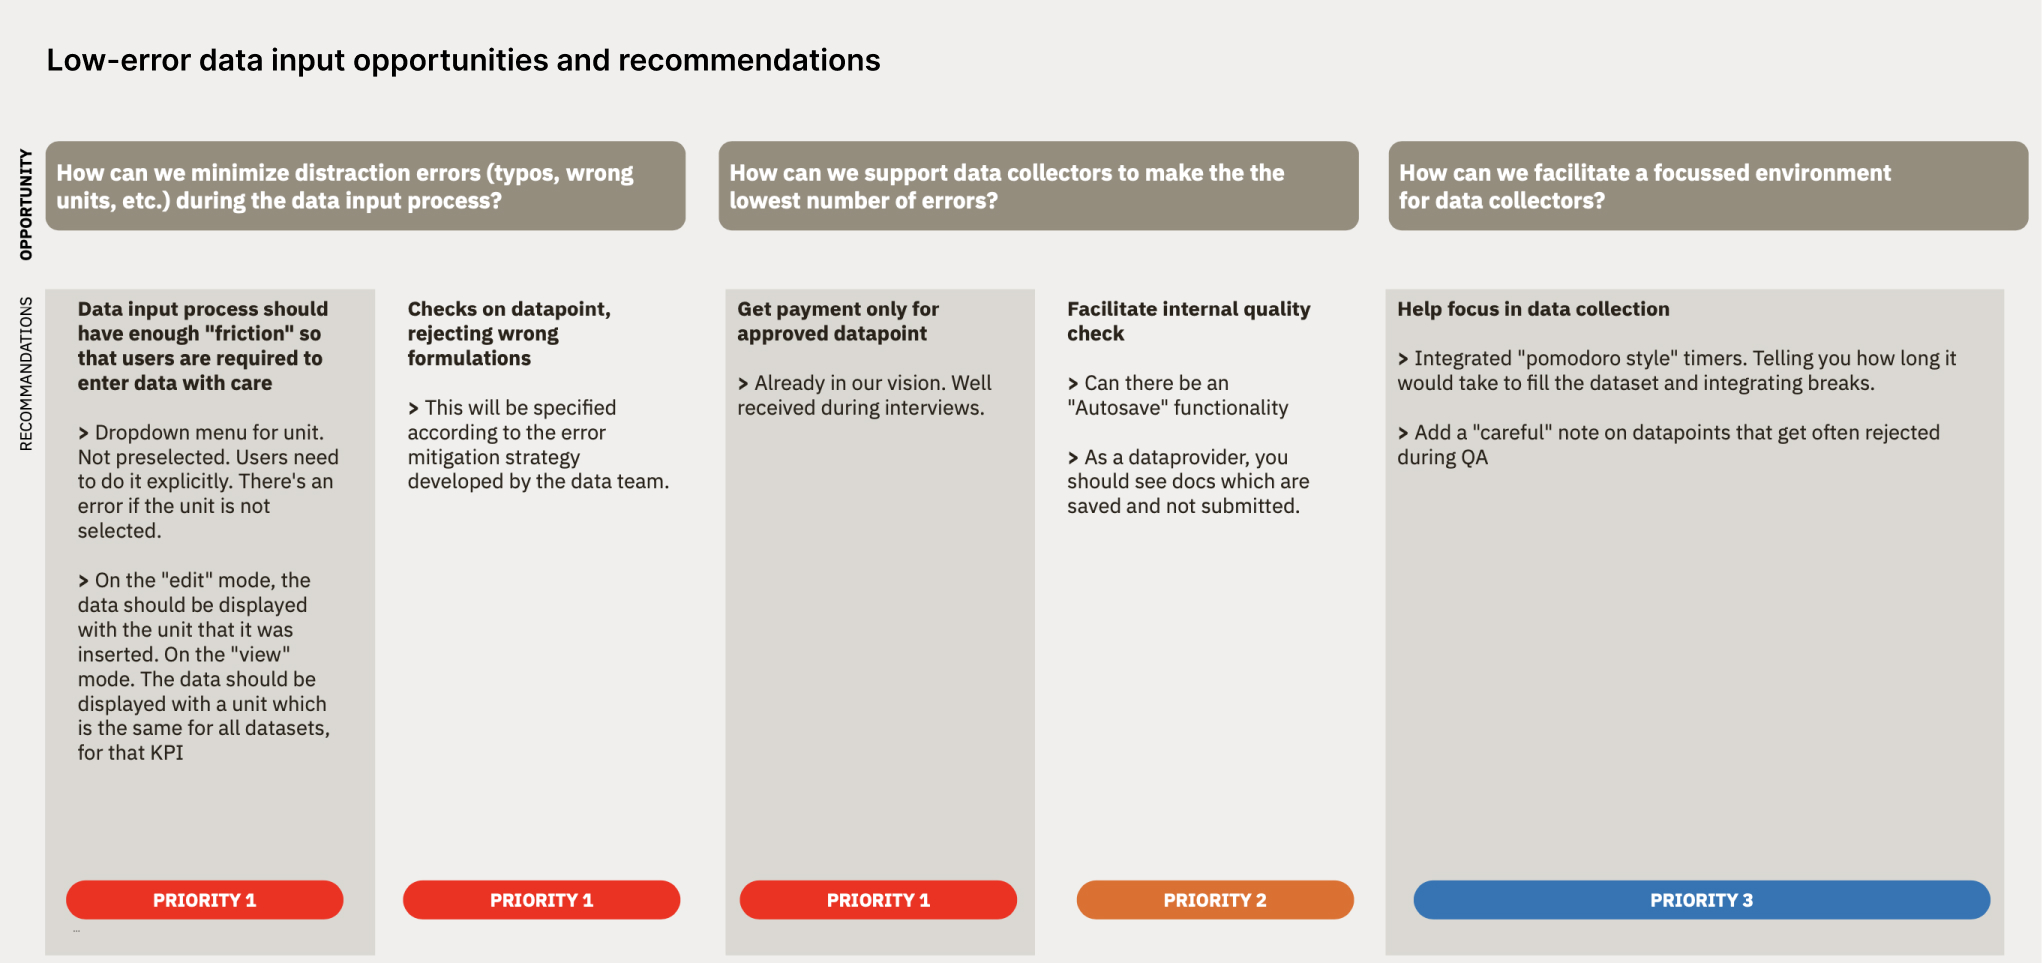
Opportunities and recommendations for Low-Error Data Input.
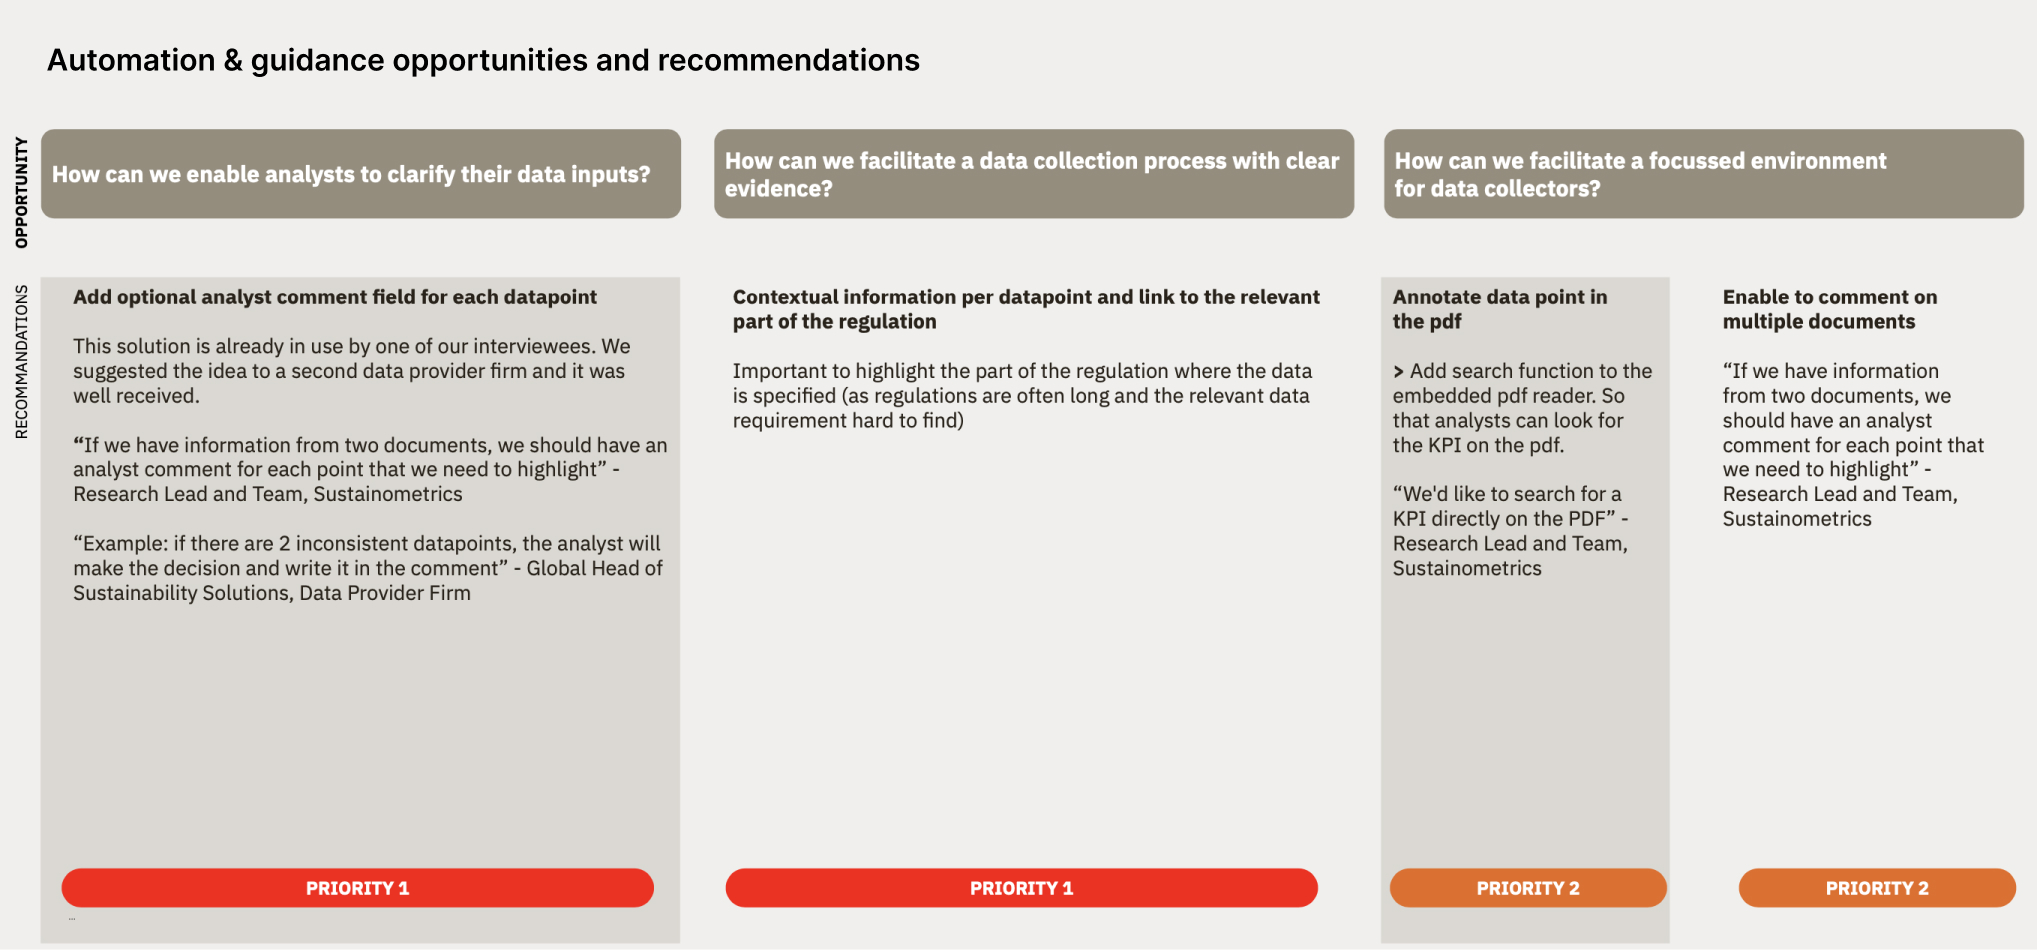
Opportunities and recommendations for Automation & Guidance.
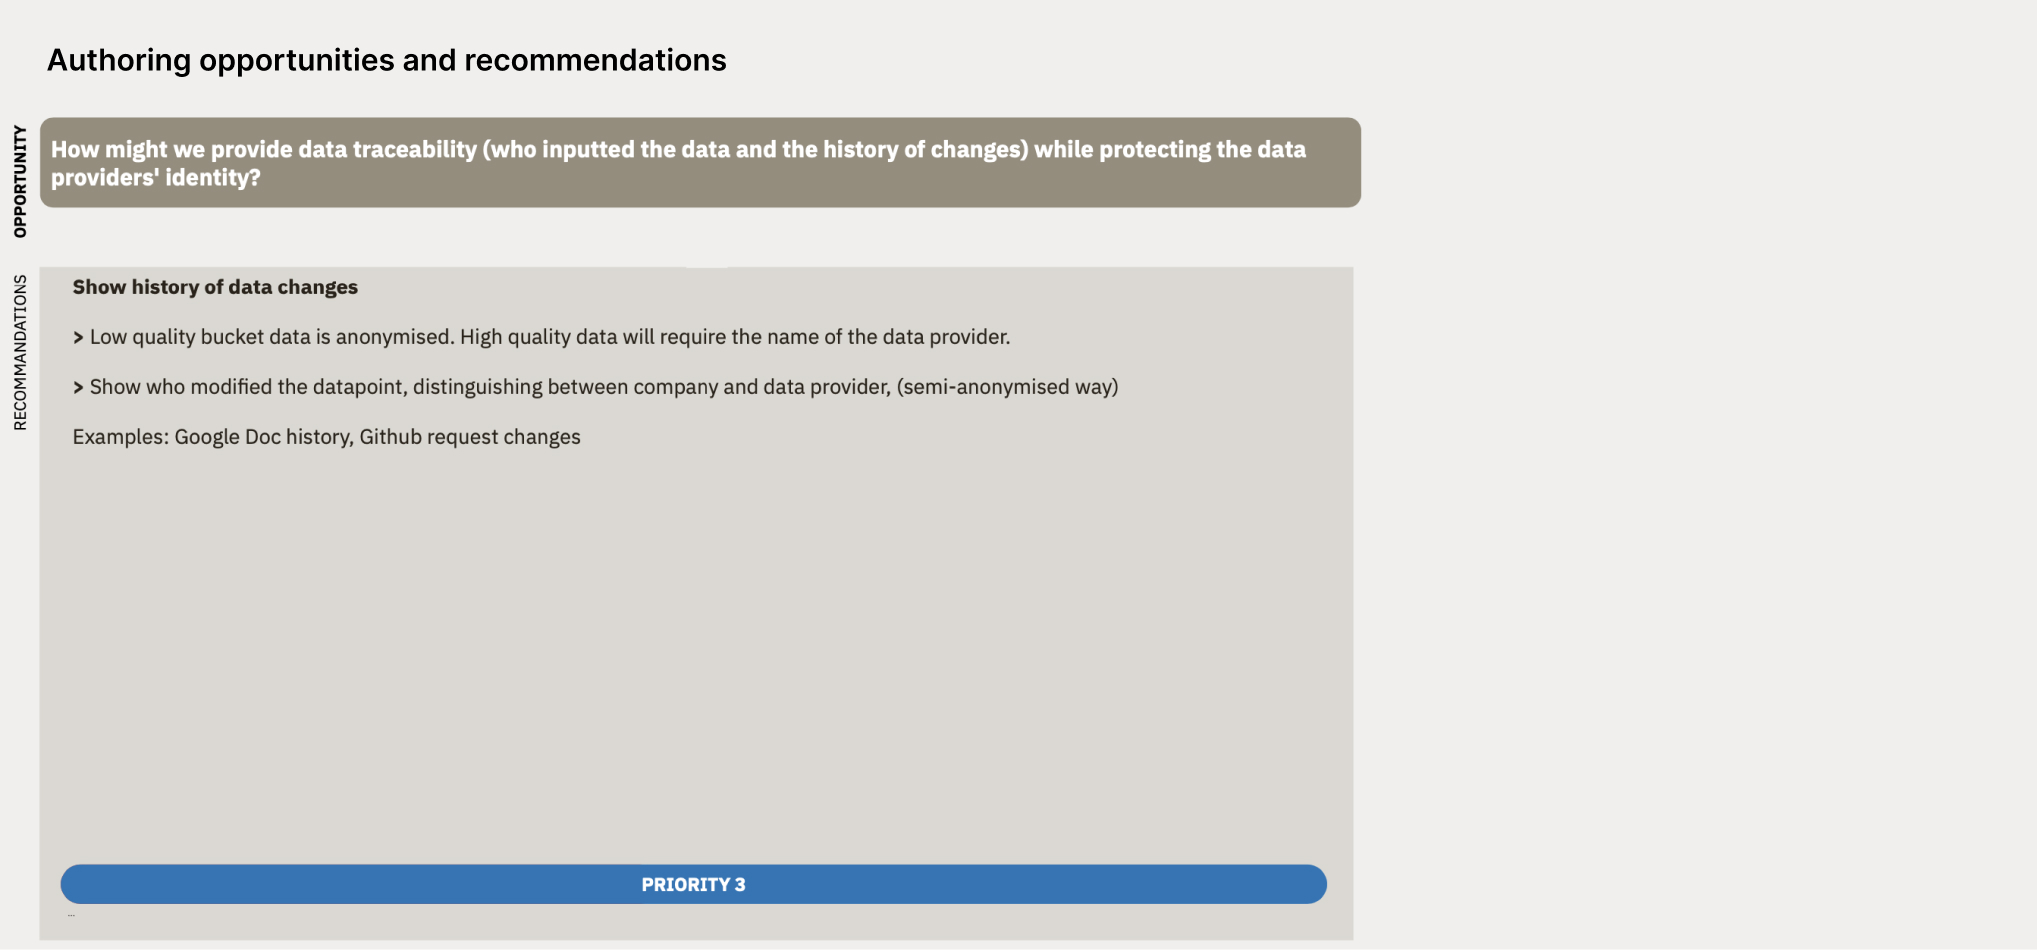
Opportunities and recommendations for Authoring.
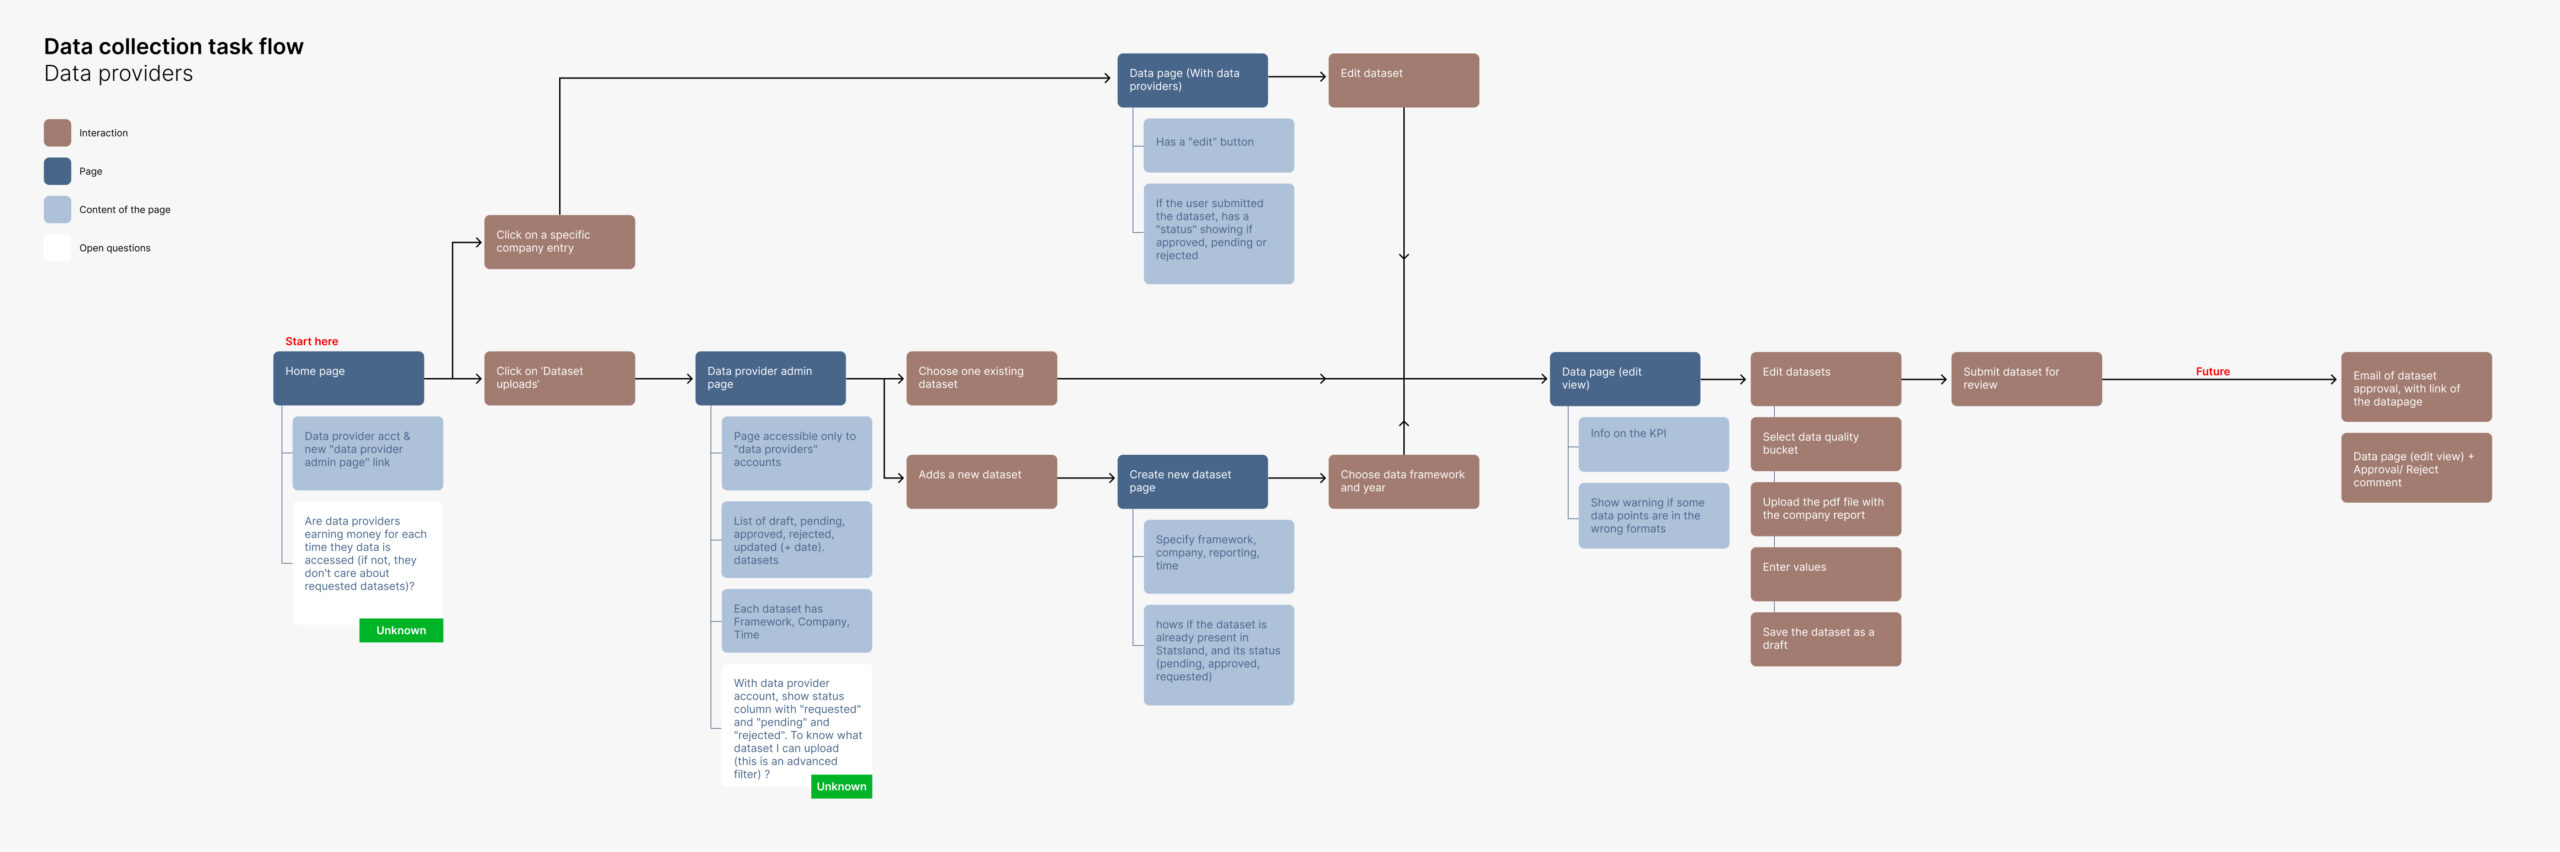
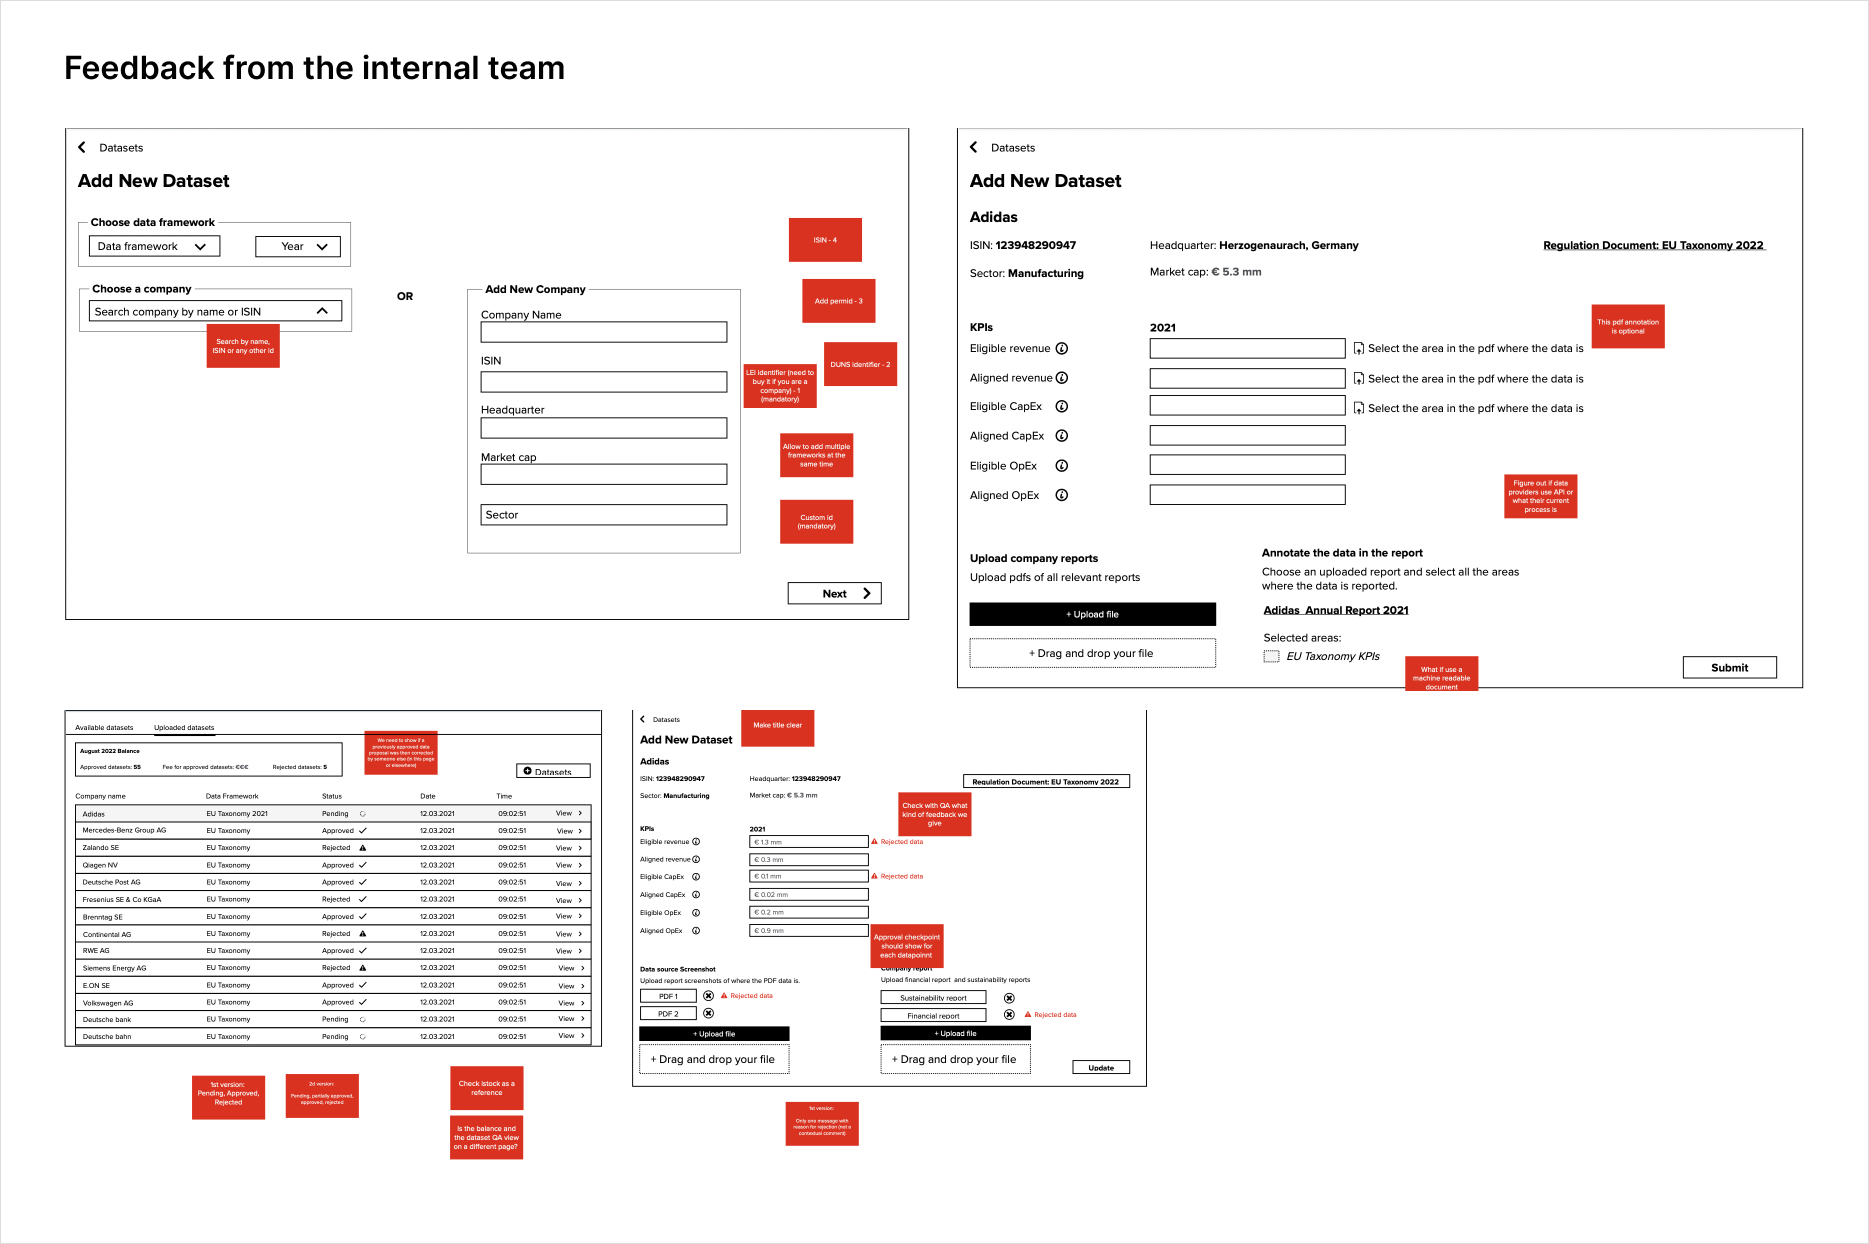
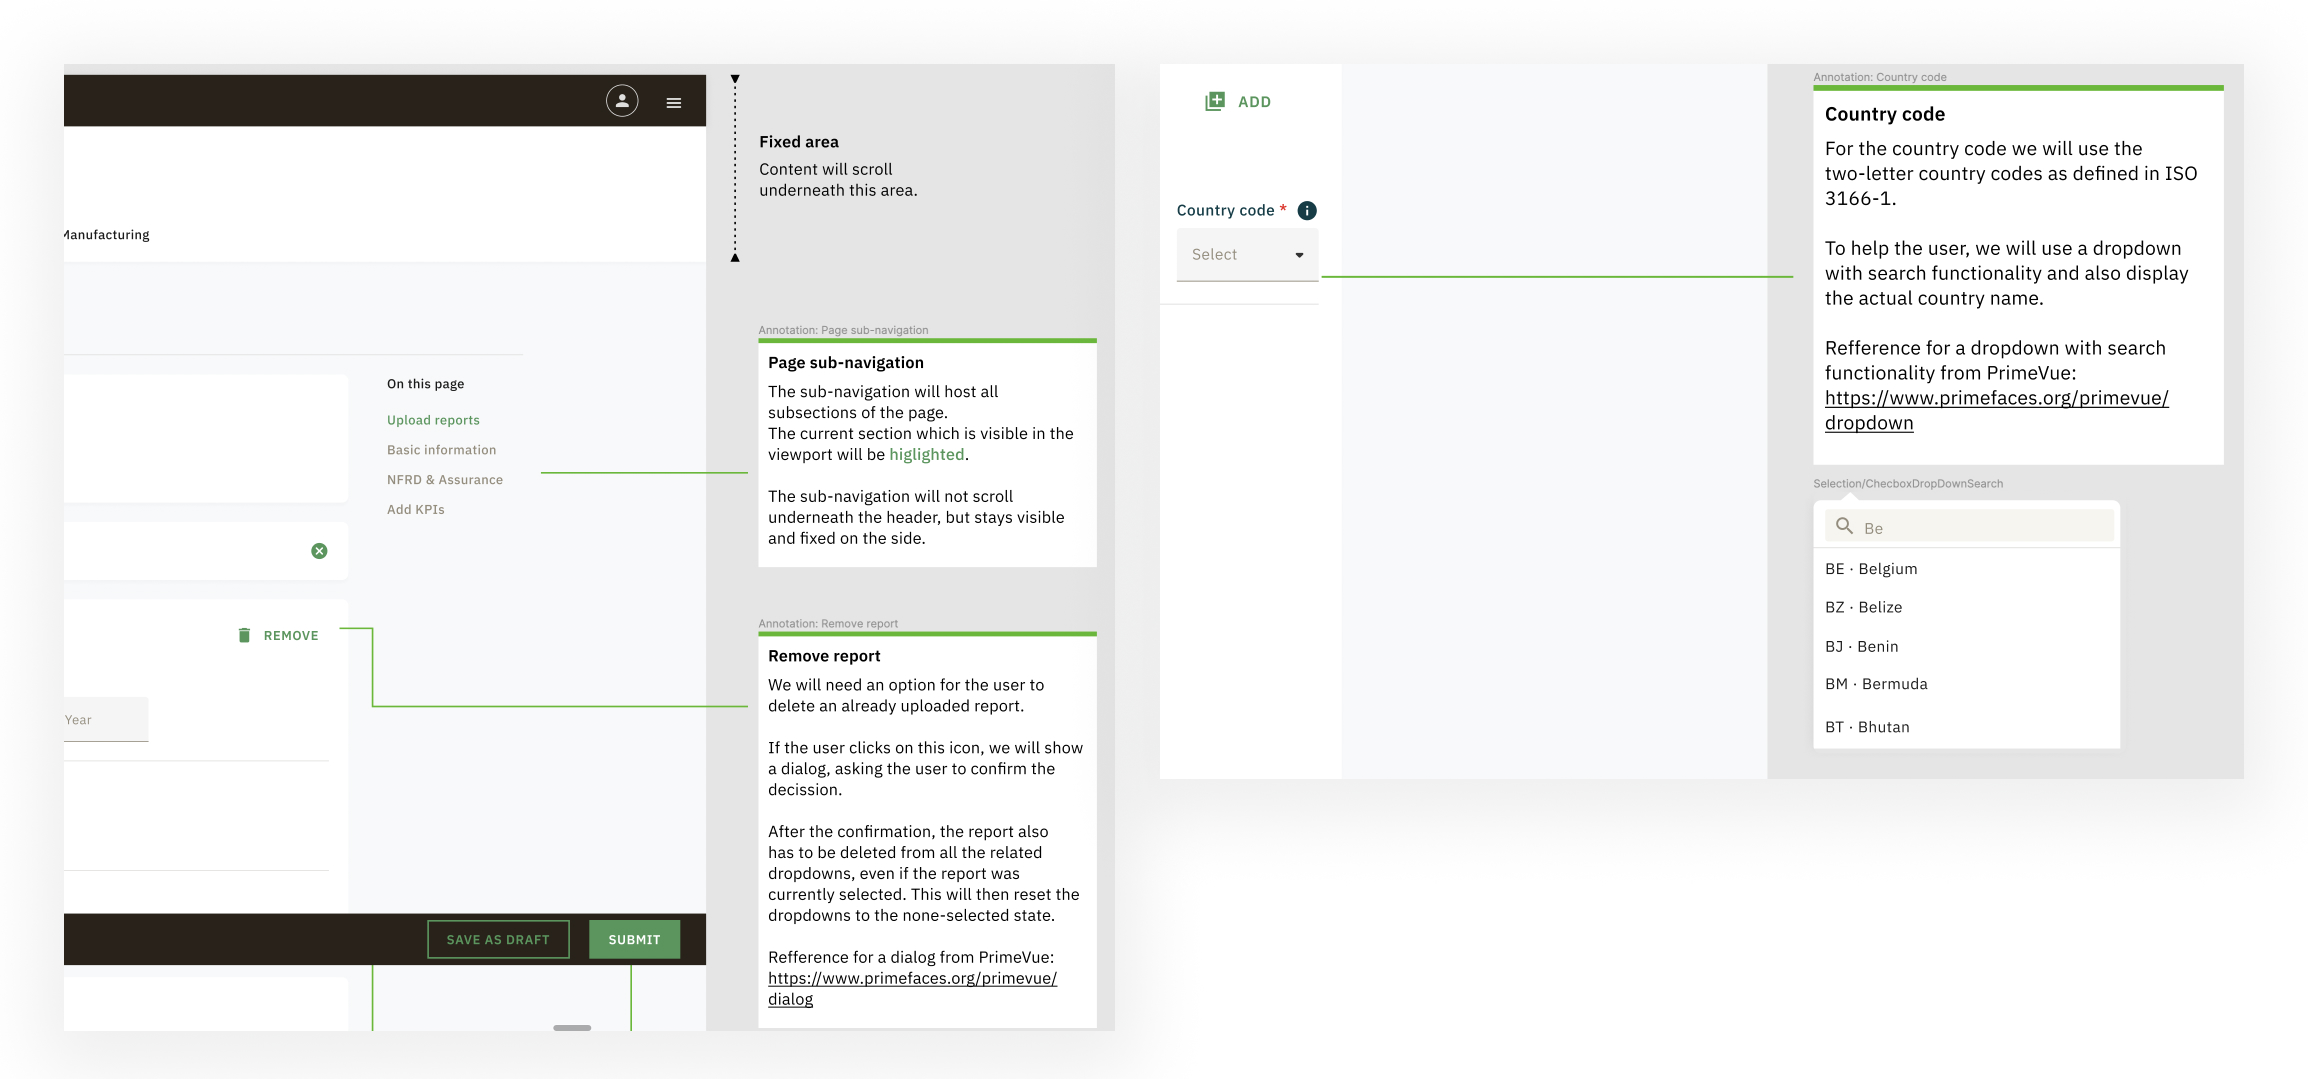
The design
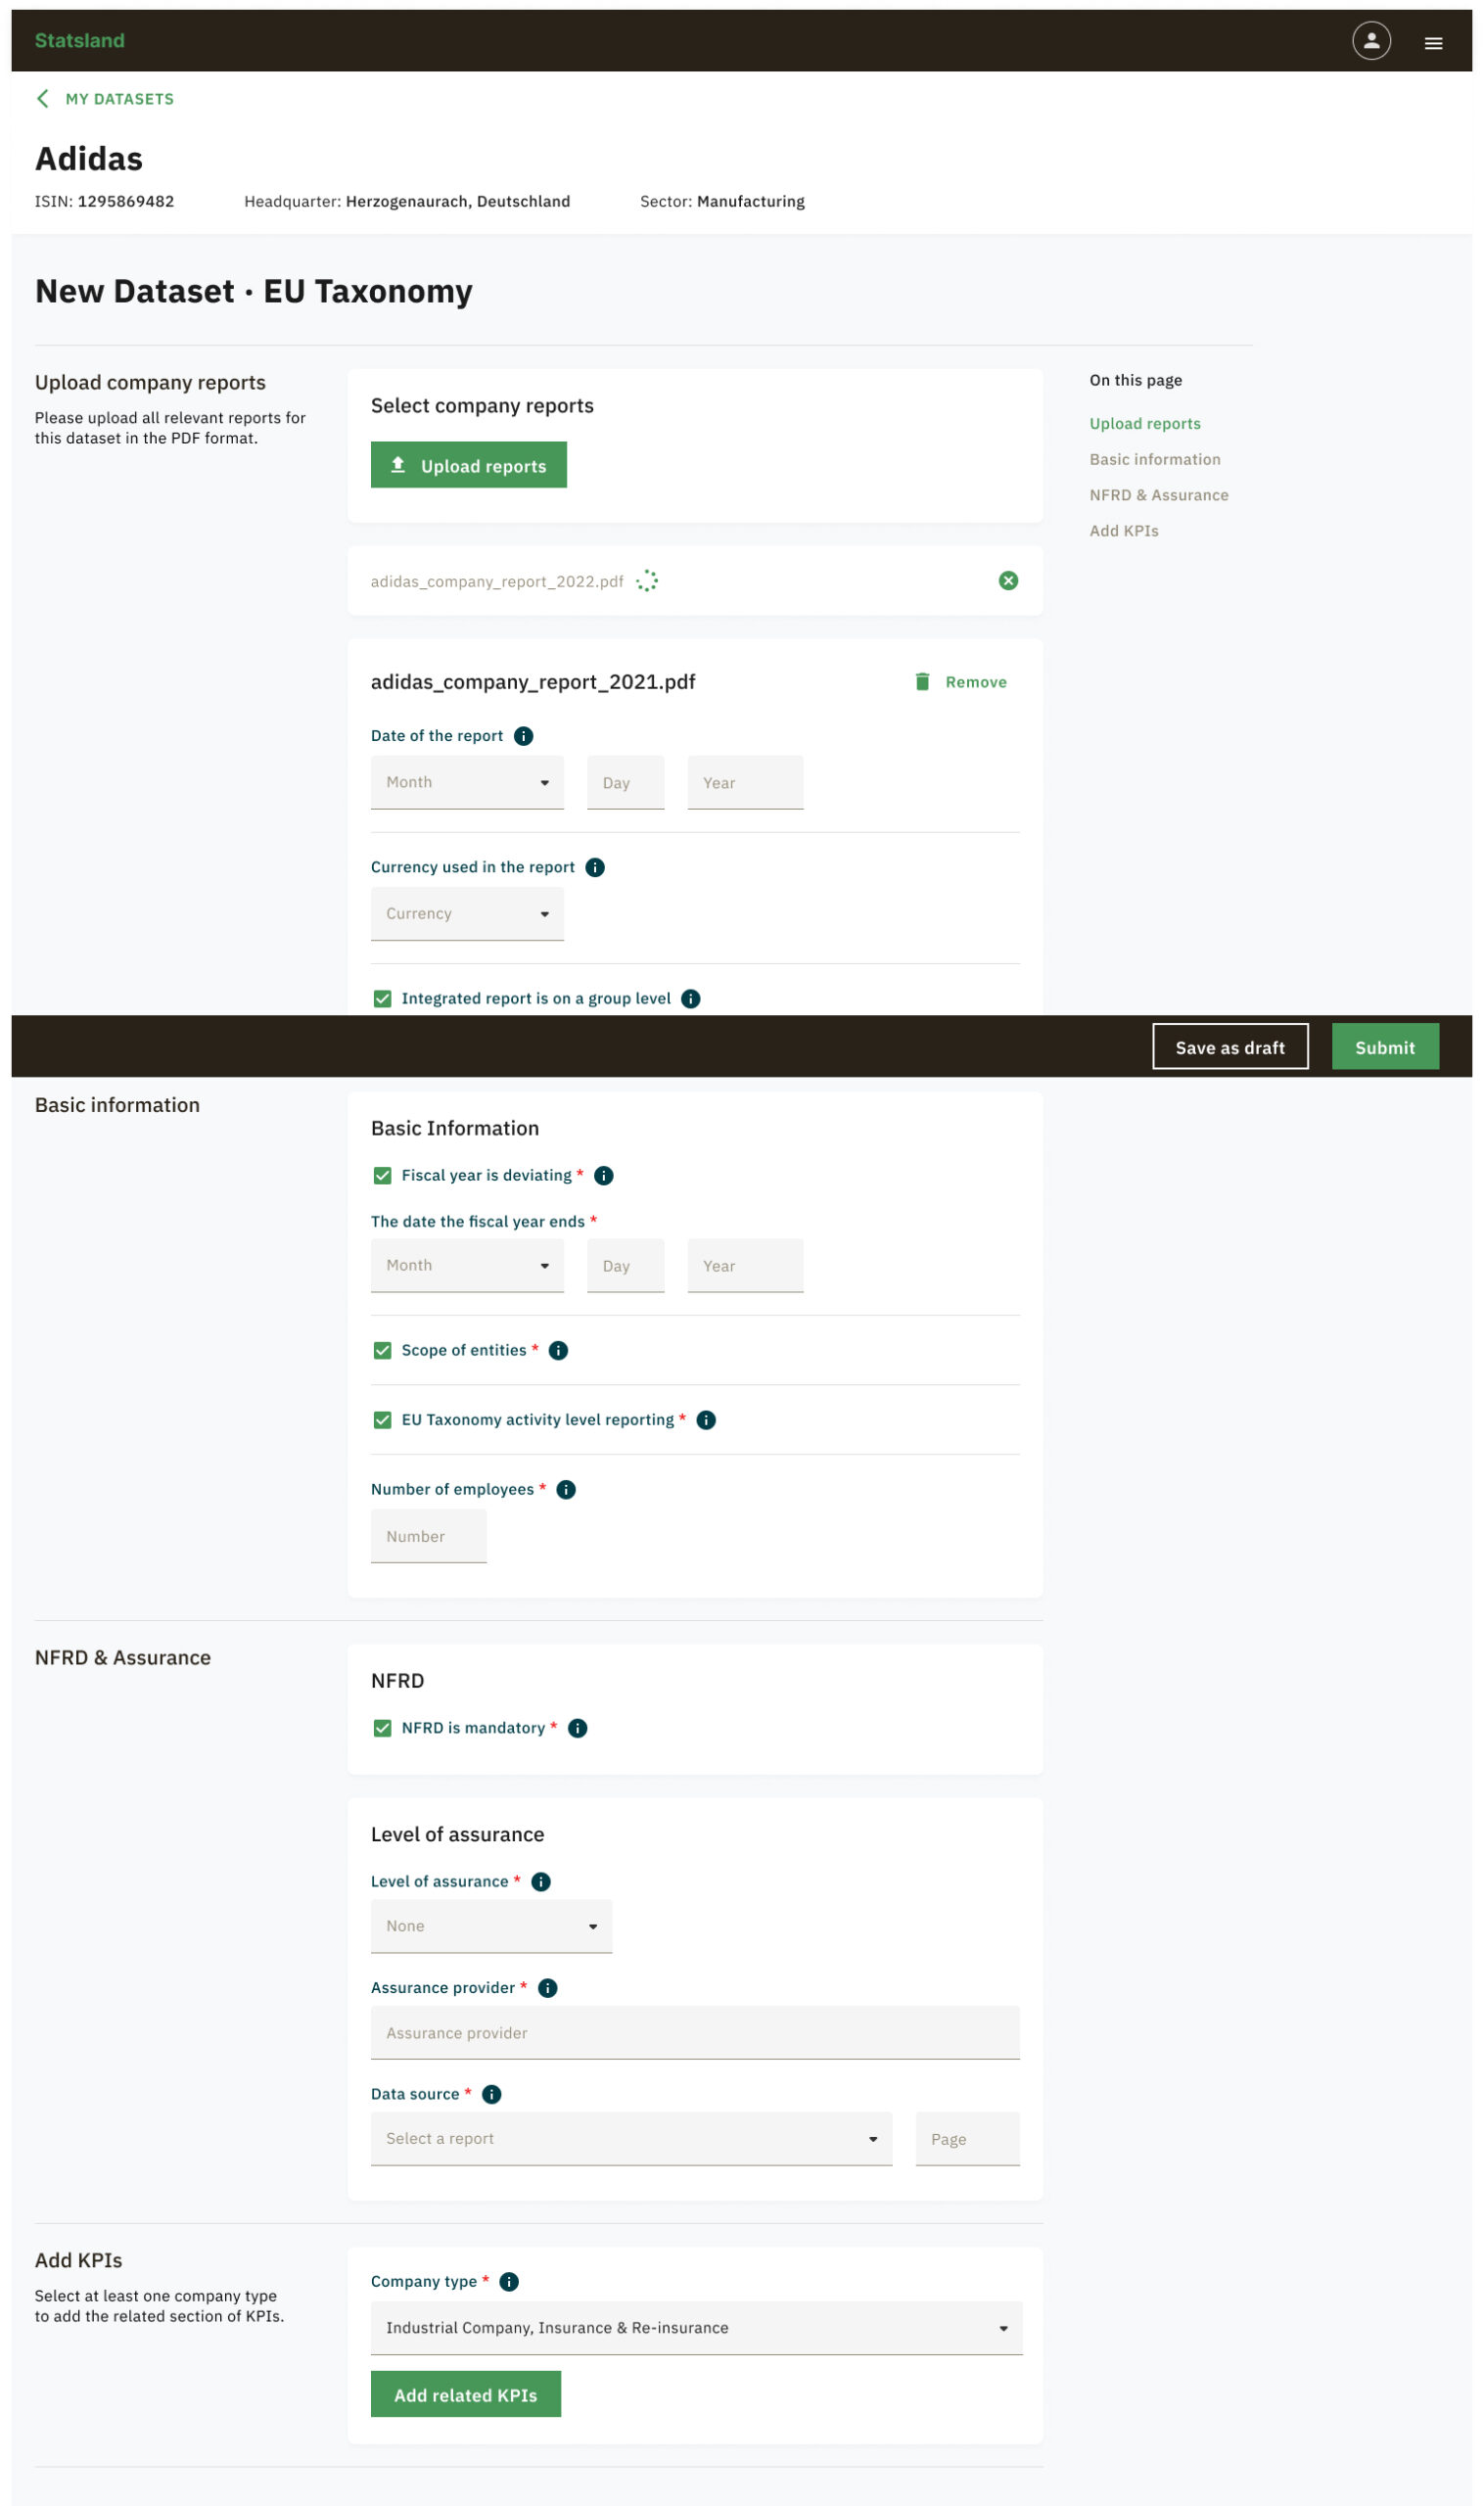
A page from data upload process.
Carrying the recommendations in to the final designs
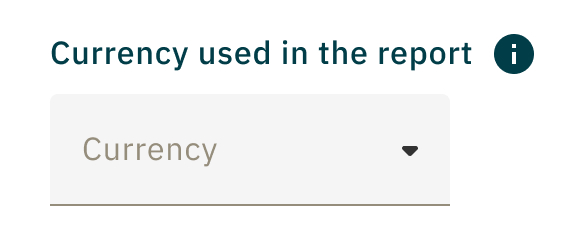
Aftering entering the amount, the currency had to be selected to make sure the entry is right. Friction was increased to prevent erroneous entry.
Real-time processing of data was done to prevent incorrect format of data entry.
Adding comment to datapoints so that the QA can be more careful before processing them.
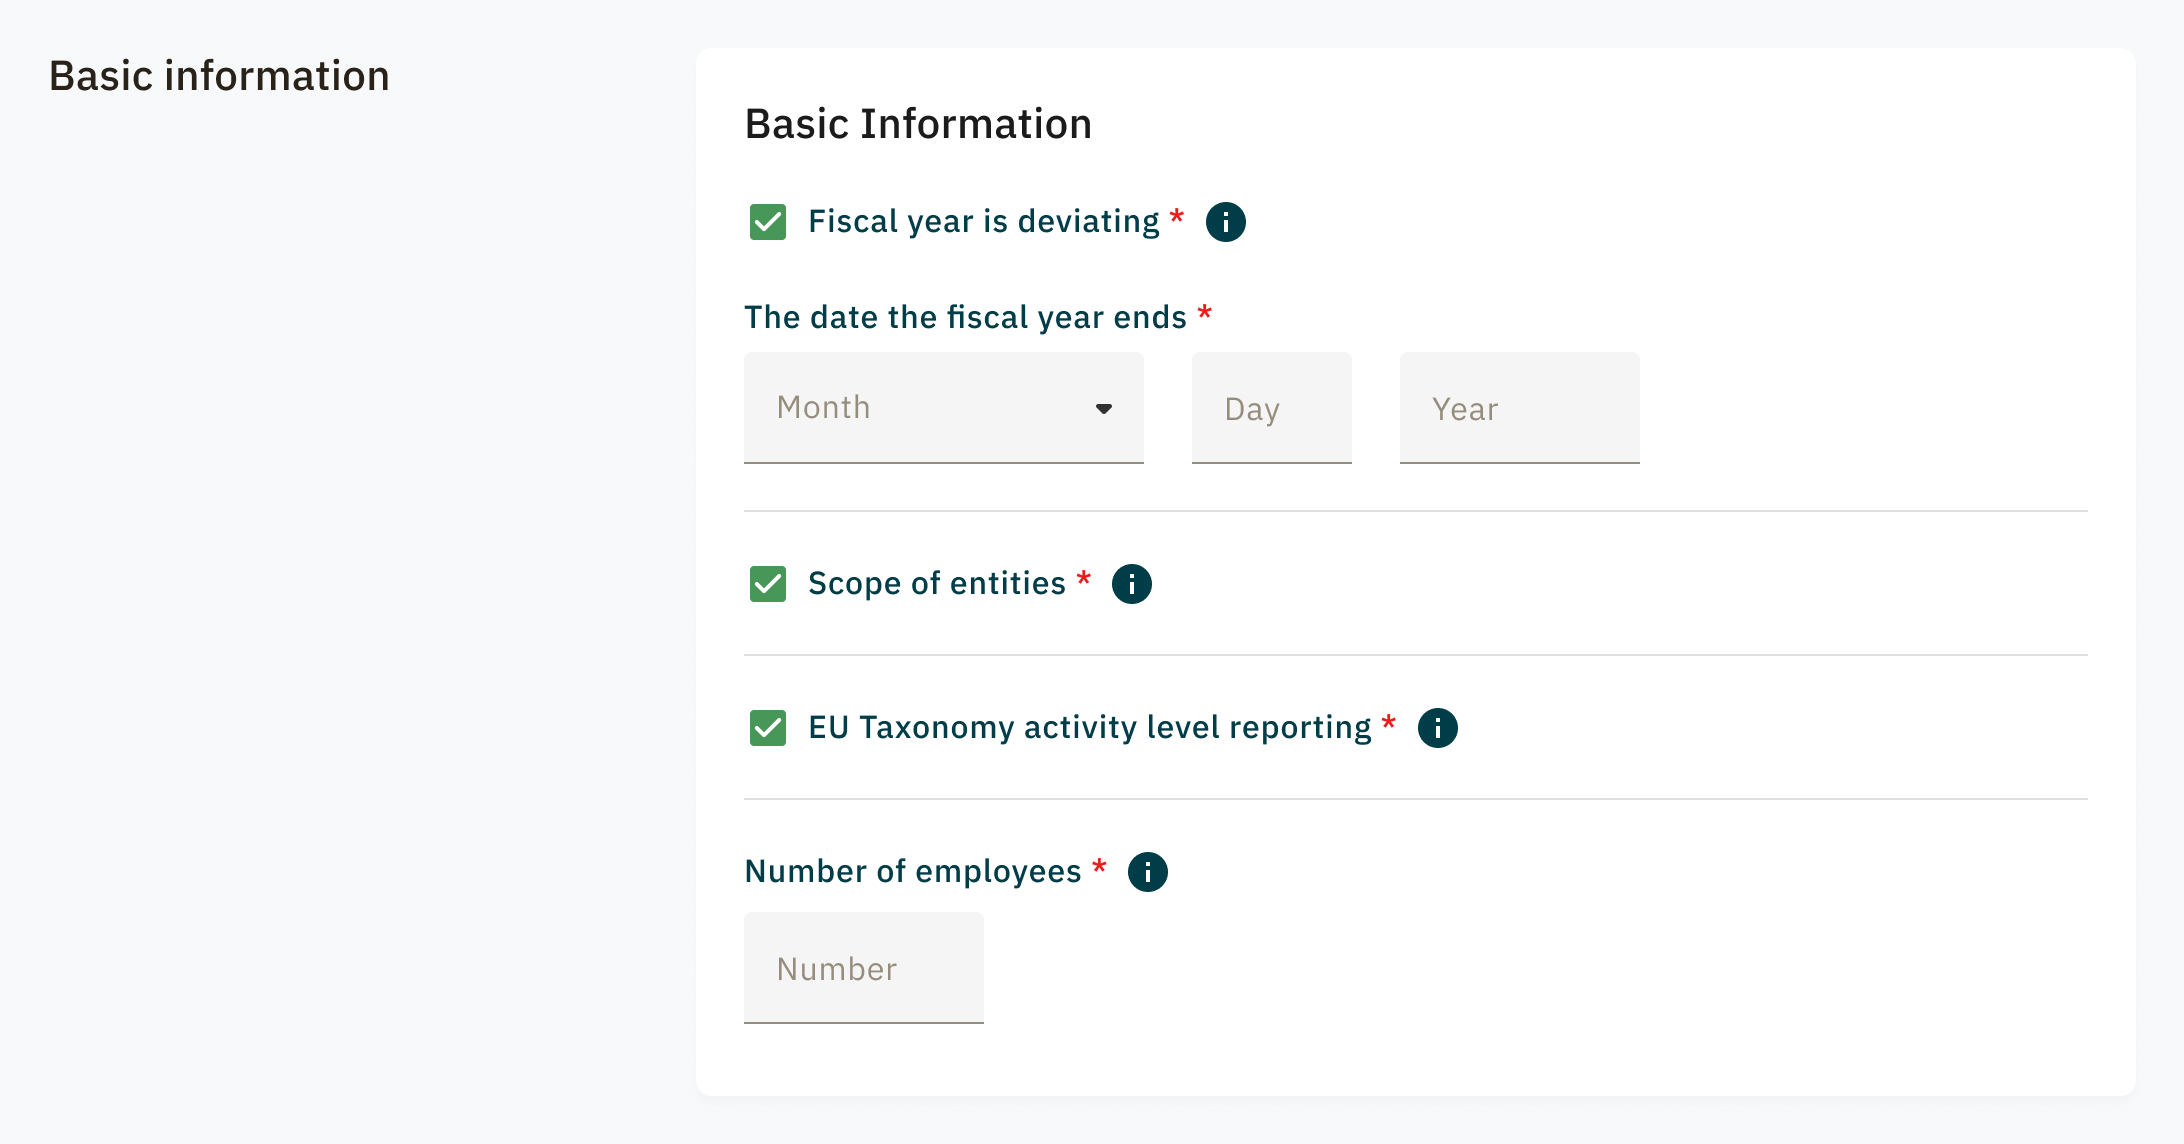
Grouping the datapoints with similar category to contextual data entry.

Saving data upload versions so that the process can be continued with breaks.
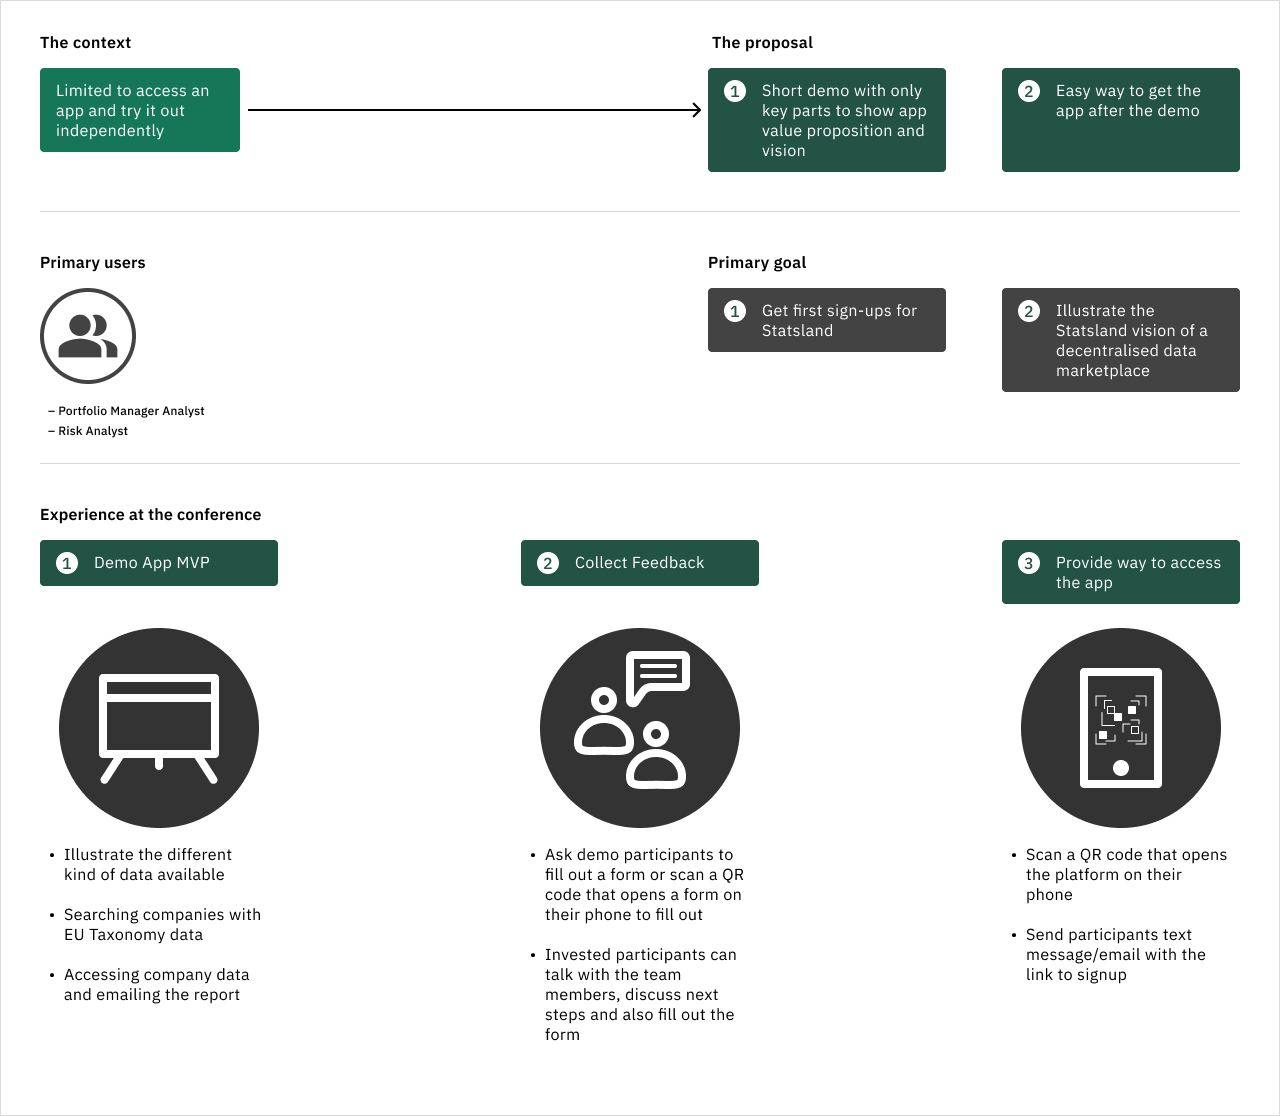
How we got here
I was onboarded to the project to design the interface. In simple terms, I was suppose to create a marketplace where ESG data of companies can be uploaded, seen and downloaded against a price. The challenges that we were facing were:
- How do we convince the companies and data users to use and share their ESG data on the platform?
- How do we get people excited about this platform?
Moreover we were trying to meet the deadline for a conference where Statsland will be presented to the world first time.
The challenge as a designer for me was to understand the topic on the go while creating artefacts for delivery and development. Together with a Service designer and the main stakeholder, we would distill down the raw information into card sorting and task flows of new data frameworks that had to be included on the platform.
A service designer, a stakeholder and I would regularly find ourselves on a white board breaking down the complexies of the information.
Content first approach
As we were going to launch Statsland at the conference, we needed to a focussed mindset to what we could accomplish. So what goes on Statsland before the conference?
We drilled down the most important parts of the platform and started from there.
We quickly learnt and added crucial information through iterations.
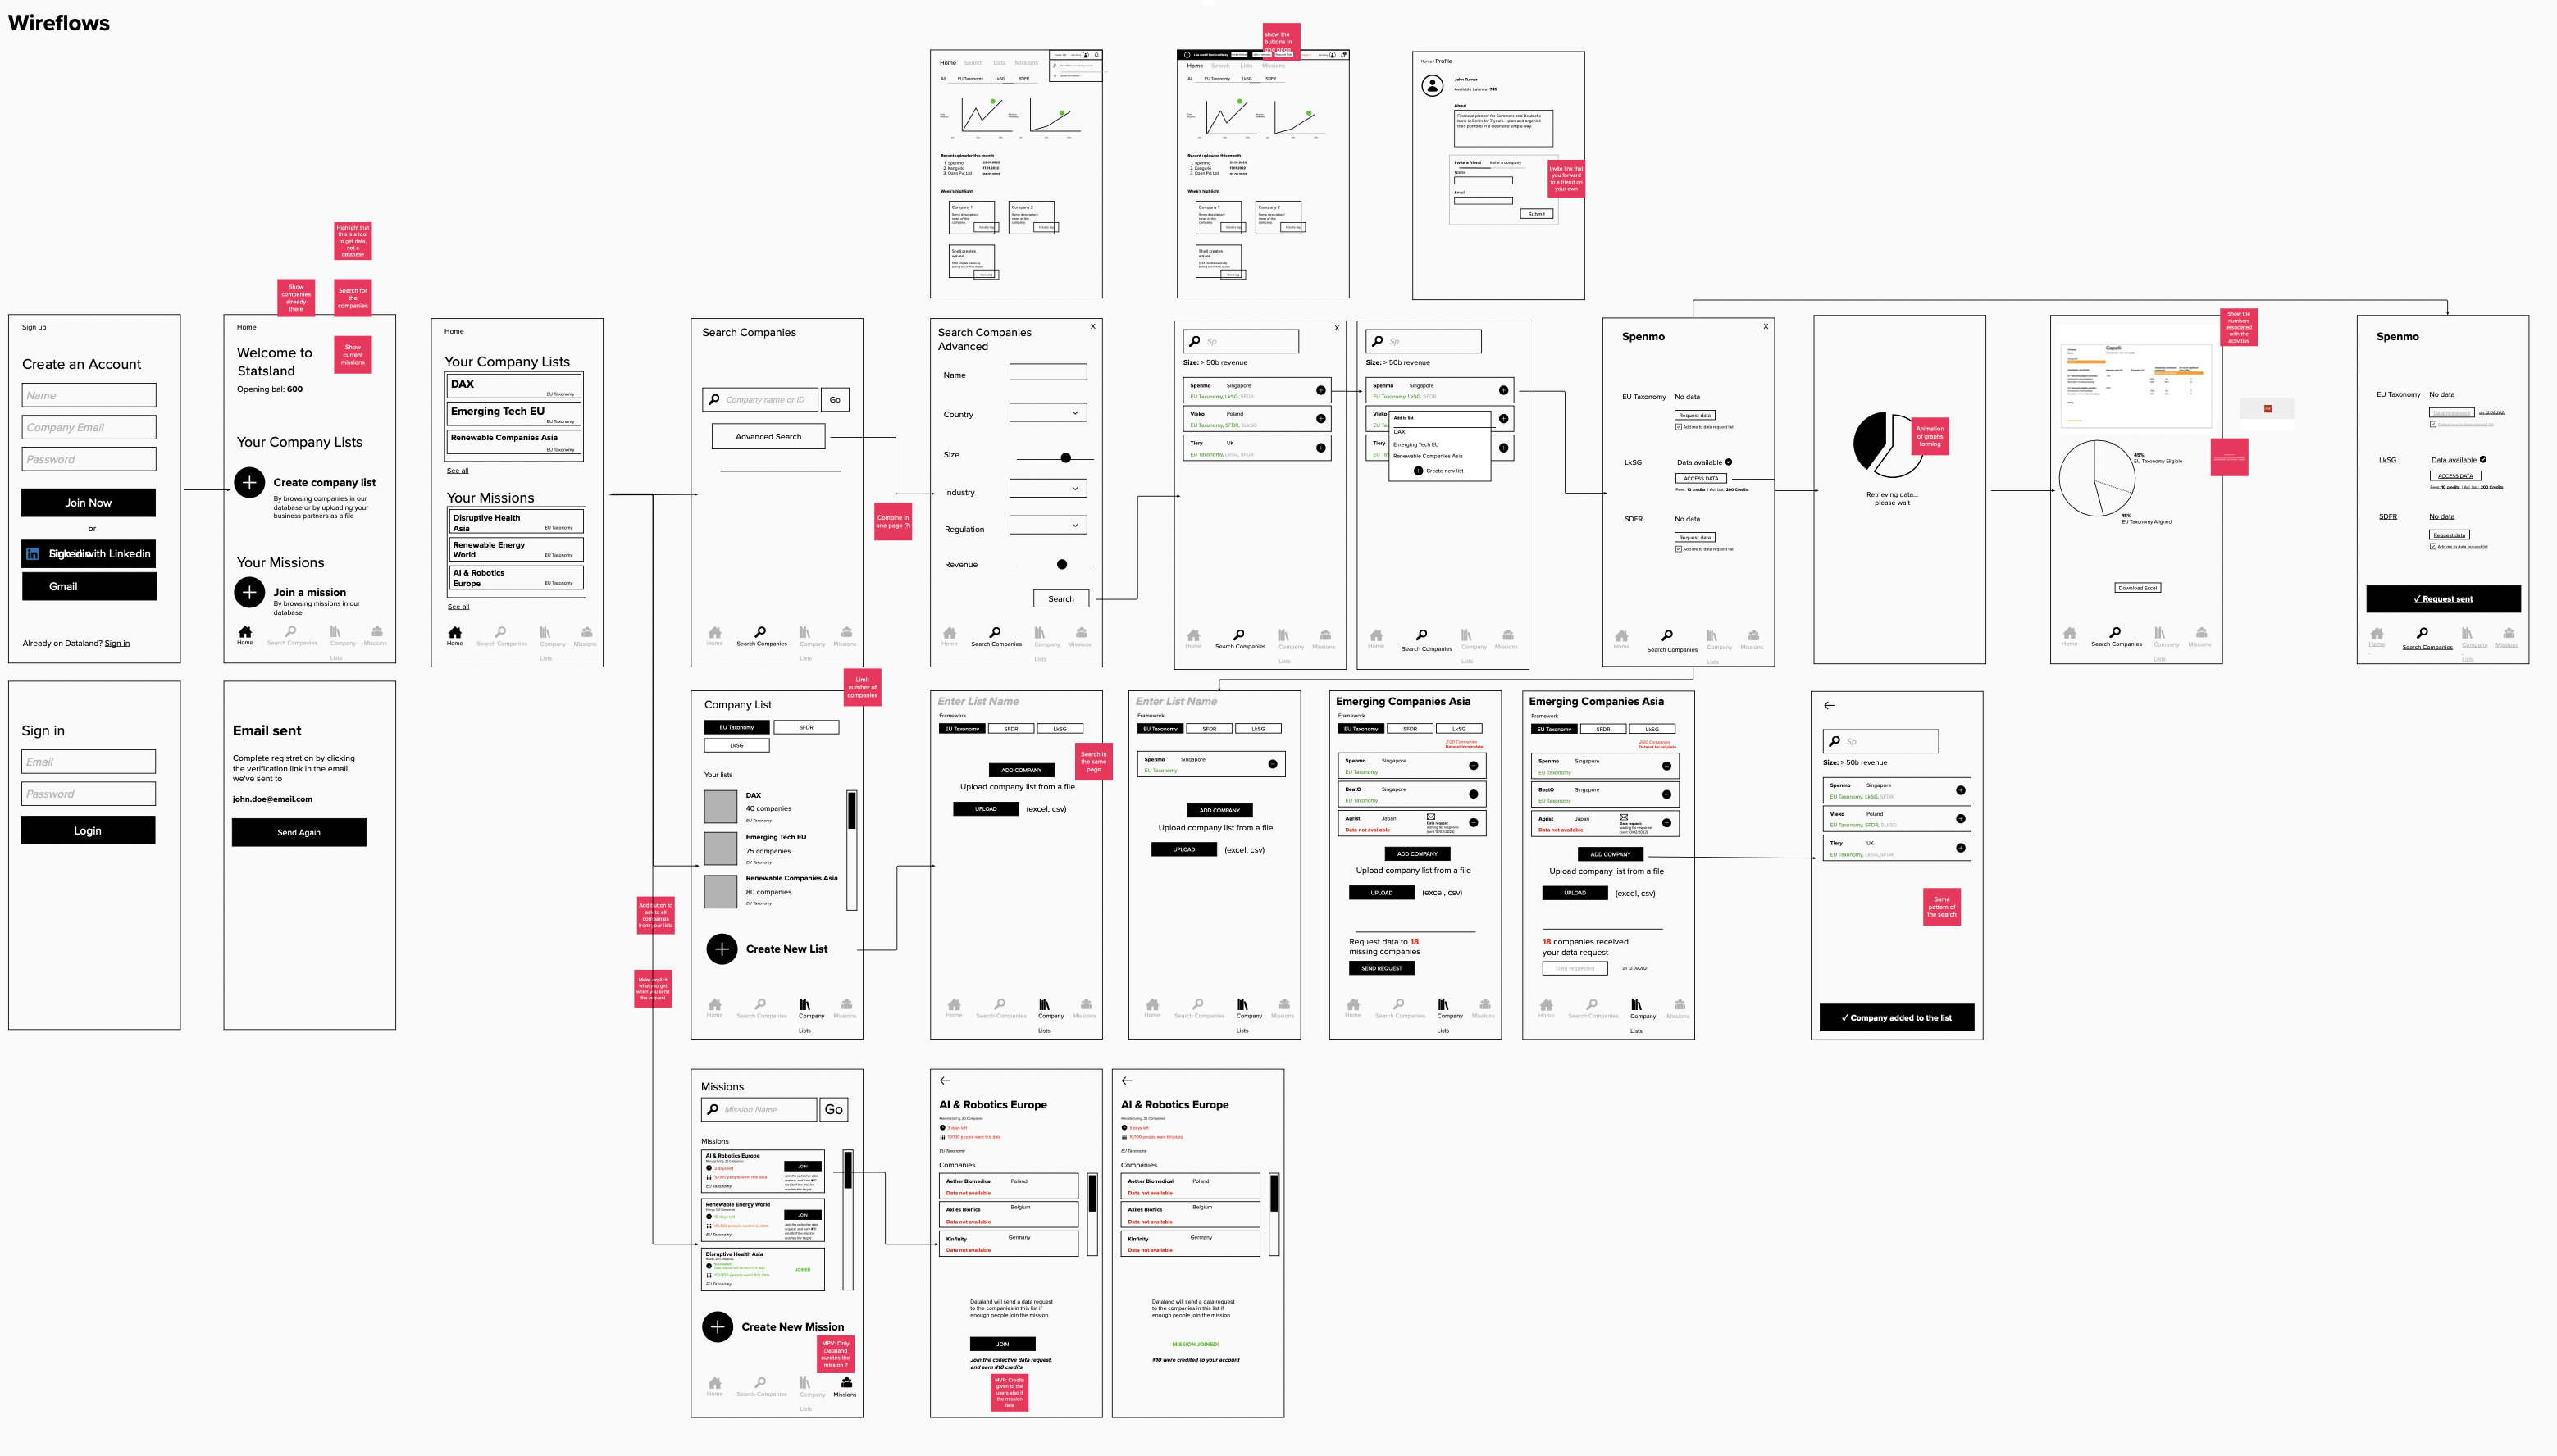
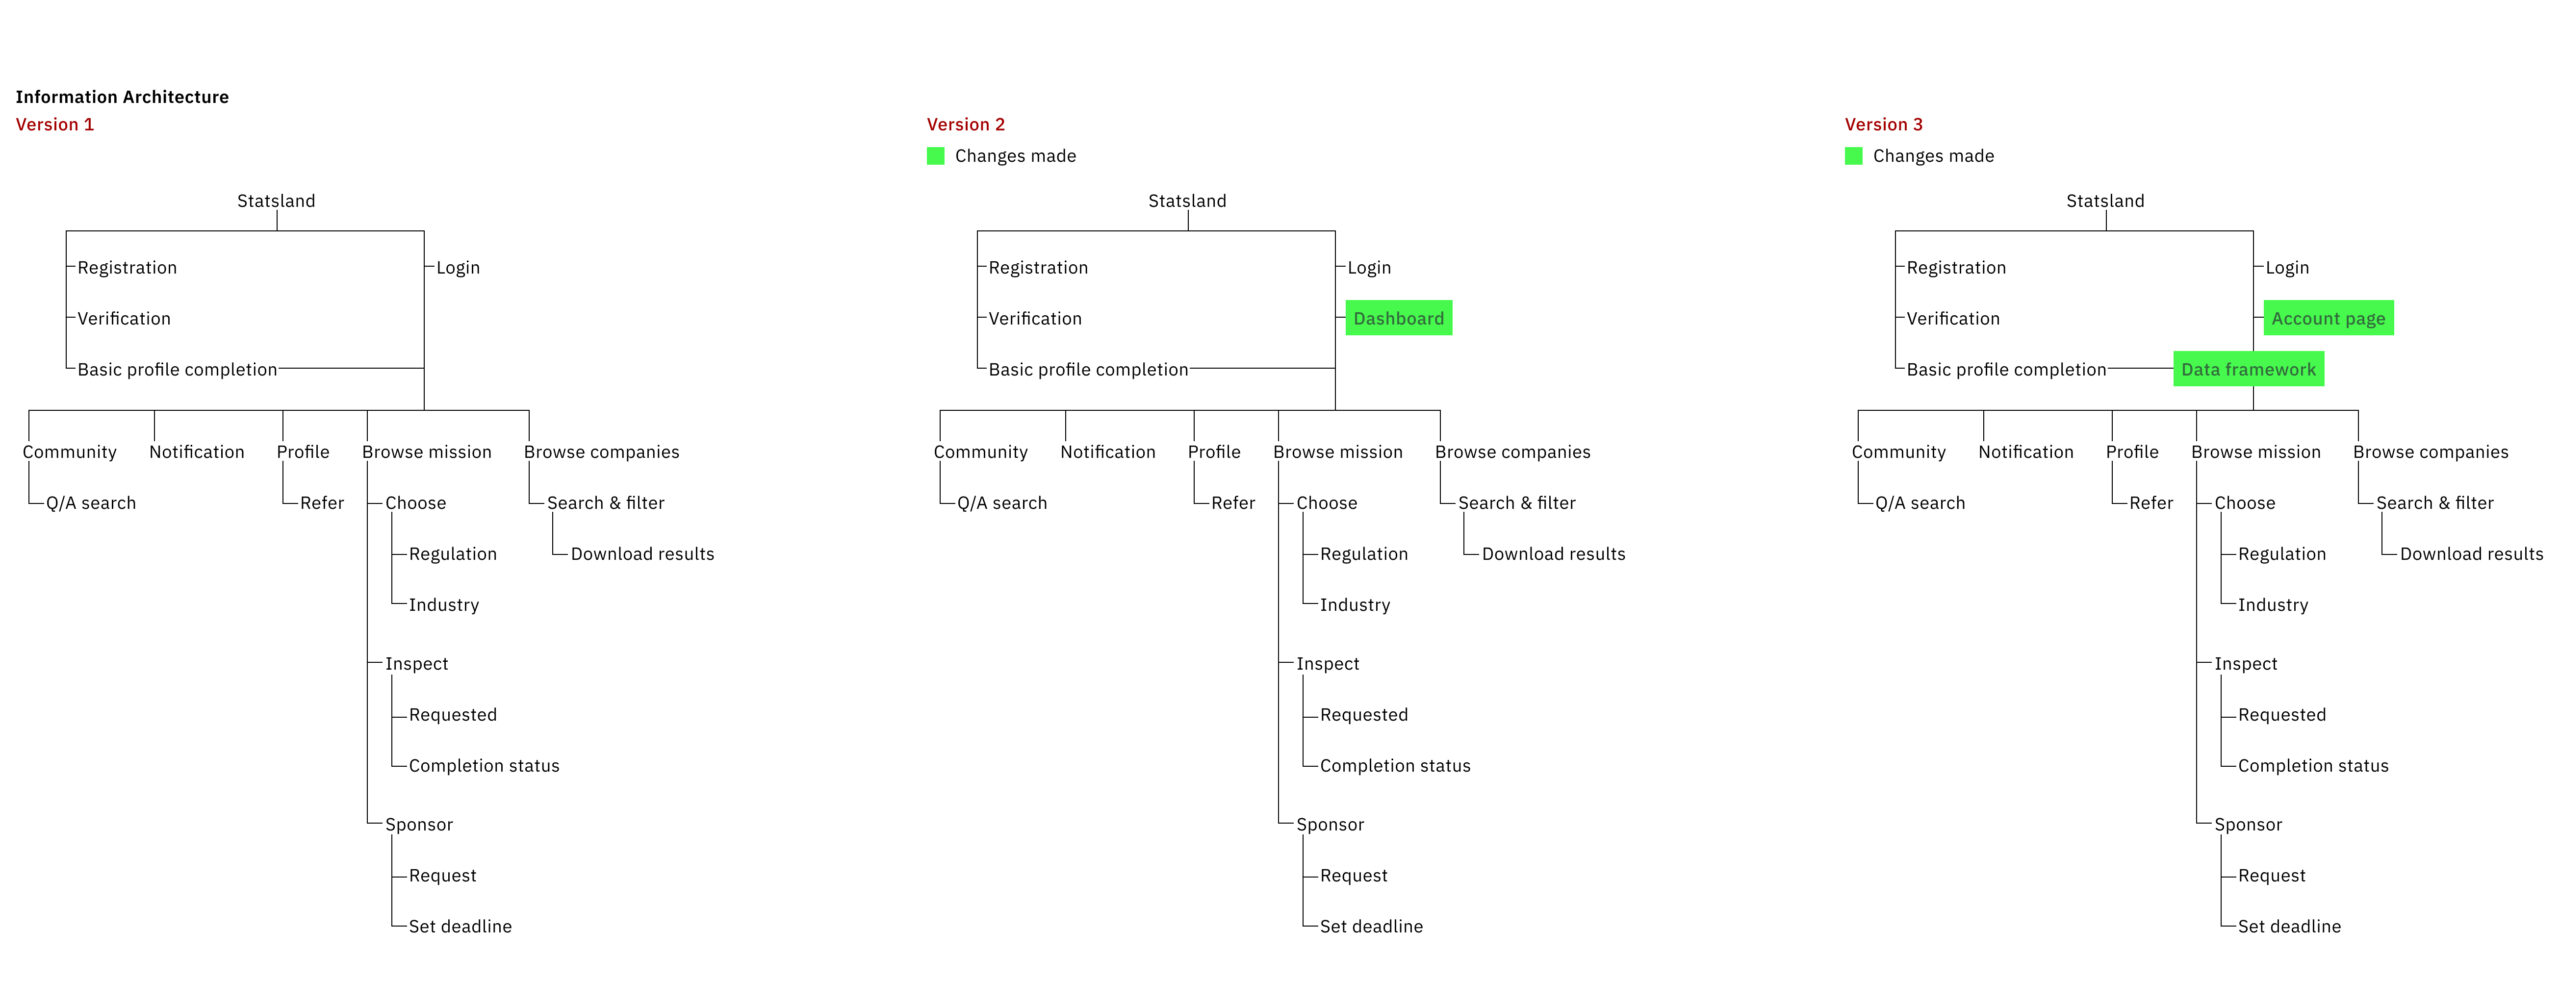
Using information architecture, wireflows were made. Initially they were made for mobile devices and later changed to desktop.
Challenge #1
Our approach to bring people to the platform
1. We offered users a taste of what they can receive—free sample data on the homepage.
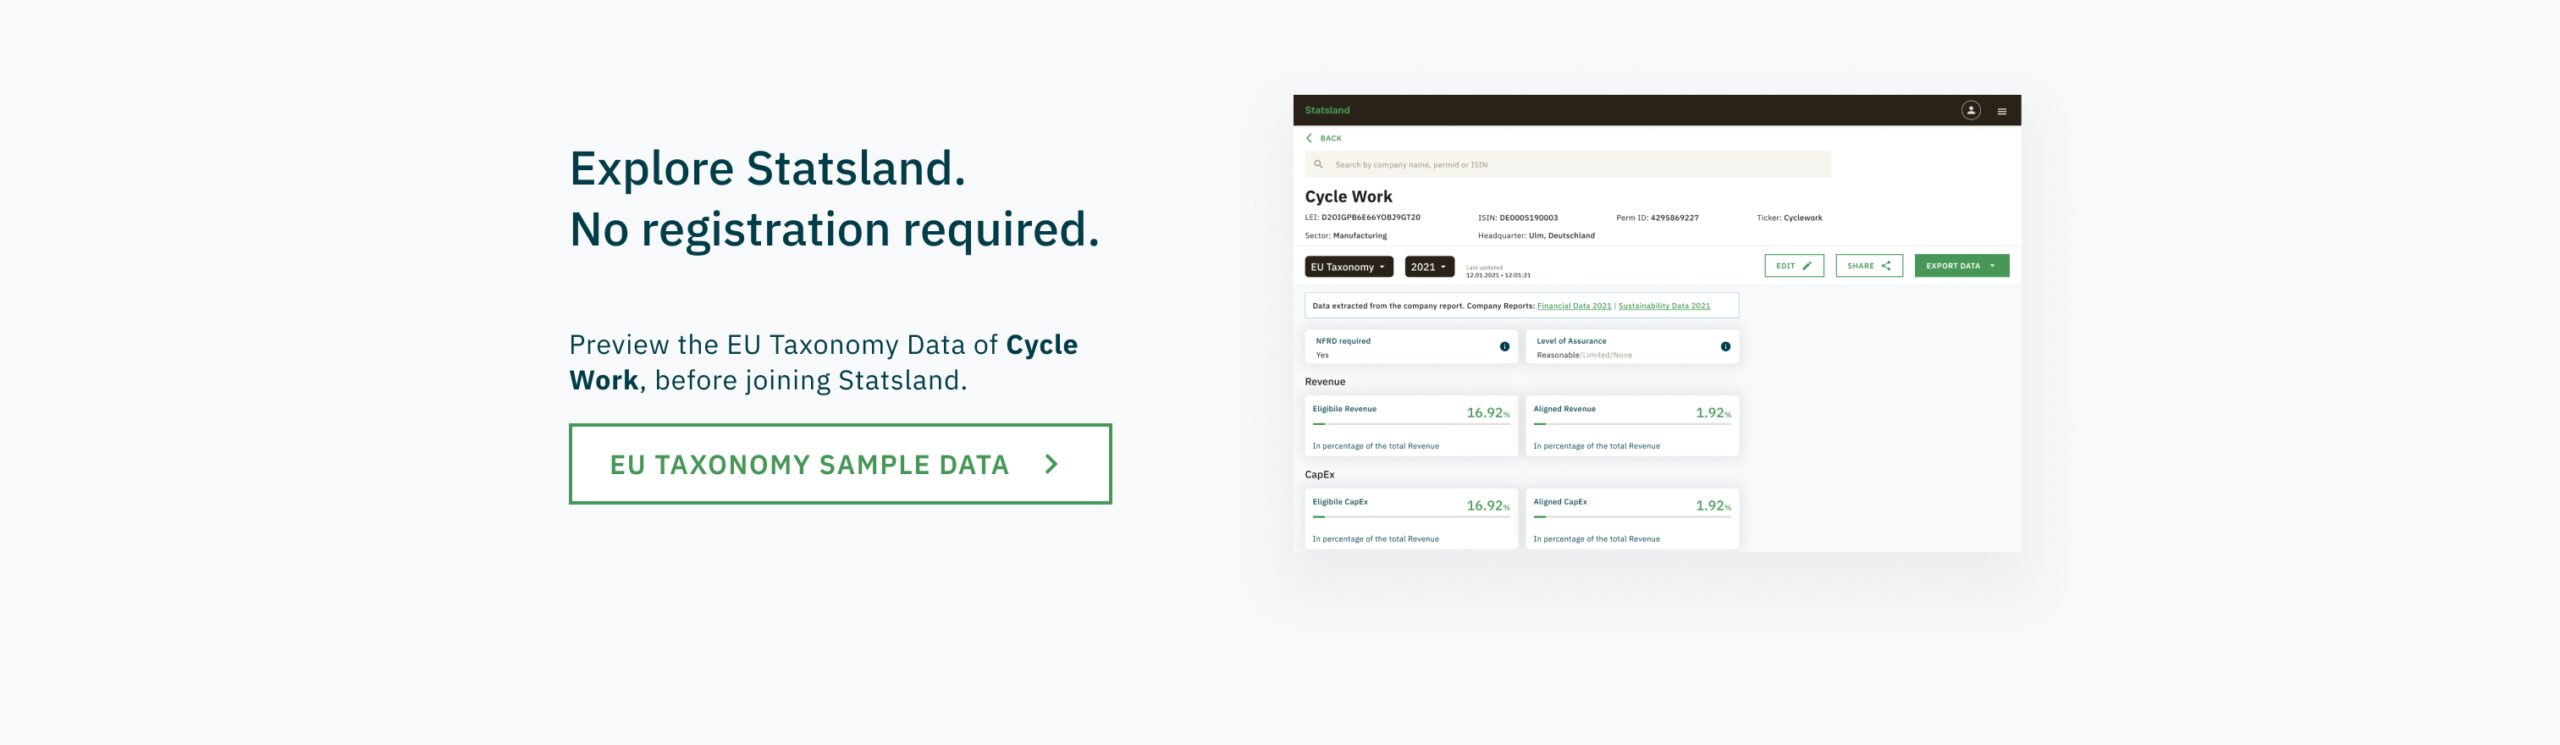
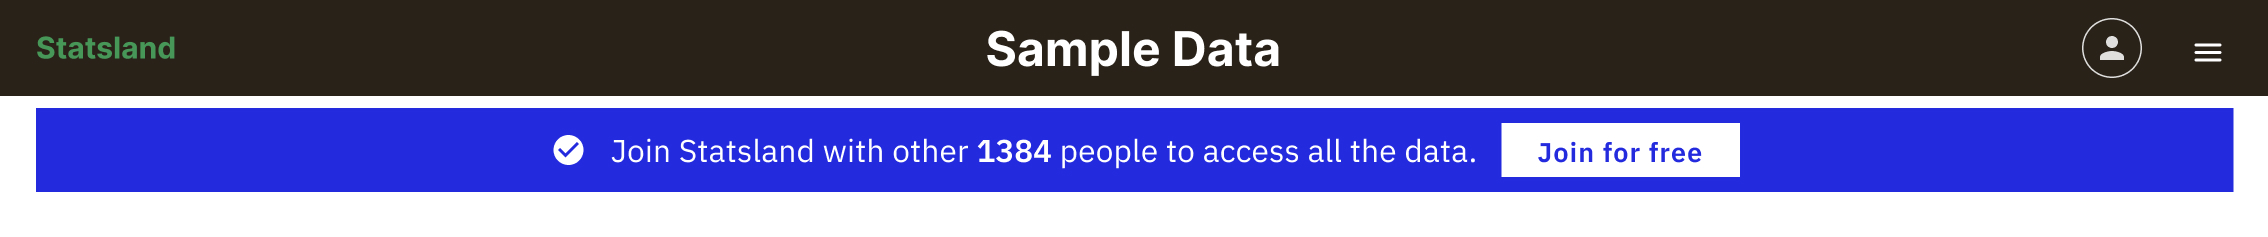
2. Once a user is viewing the sample data, show that they can join for free and view the number of people who are already on the platform.
3. Share a report of a company you’re viewing to other if you have a Statsland account
Challenge #2
Getting people excited
As we were going to raise curtains on the product, we had to work backwards and meet the deadlines. We put strategy in place so that we can create curiousity and gain traction.
Another workflow
Request data from companies
Companies don't always provide their ESG data. In that case, if someone wants to know data of a particular company, they can create a request on Statsland in the format prescribed and Statsland take care of the rest. Statsland then sends the request to the concern company and procures their data and publishes it.
Concepts that didn’t make it
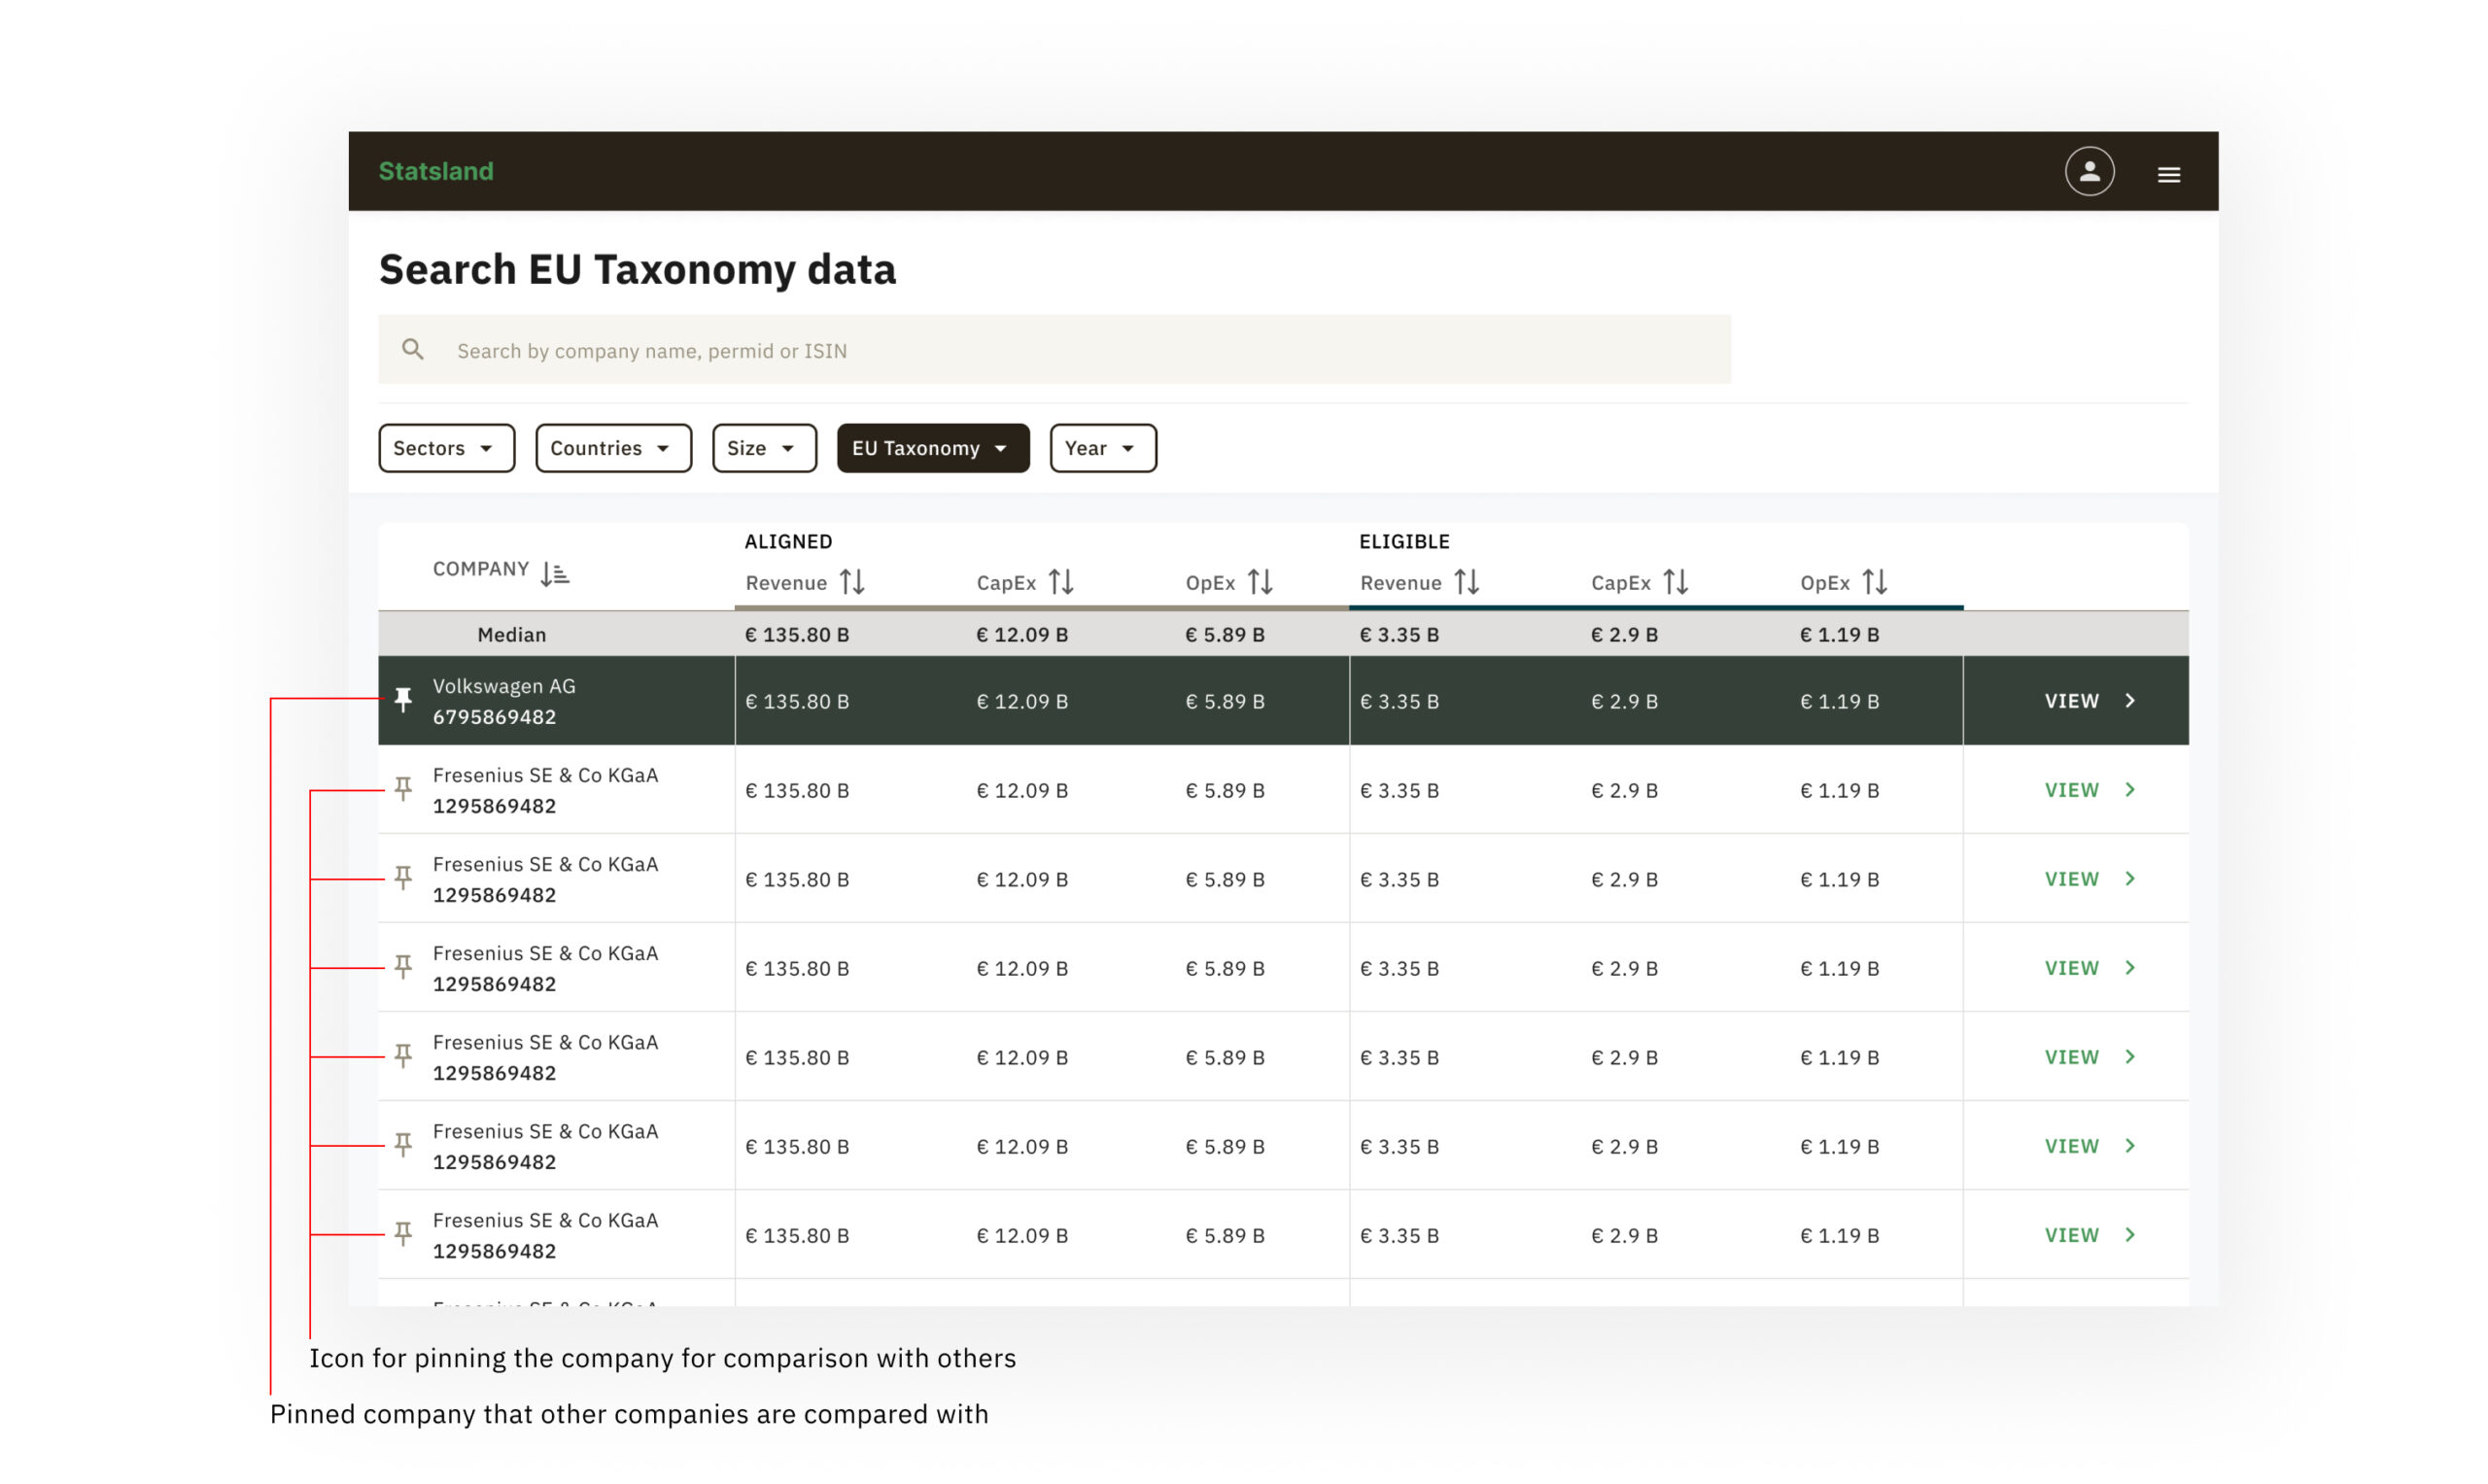
Comparison of companies data while pinning a company.
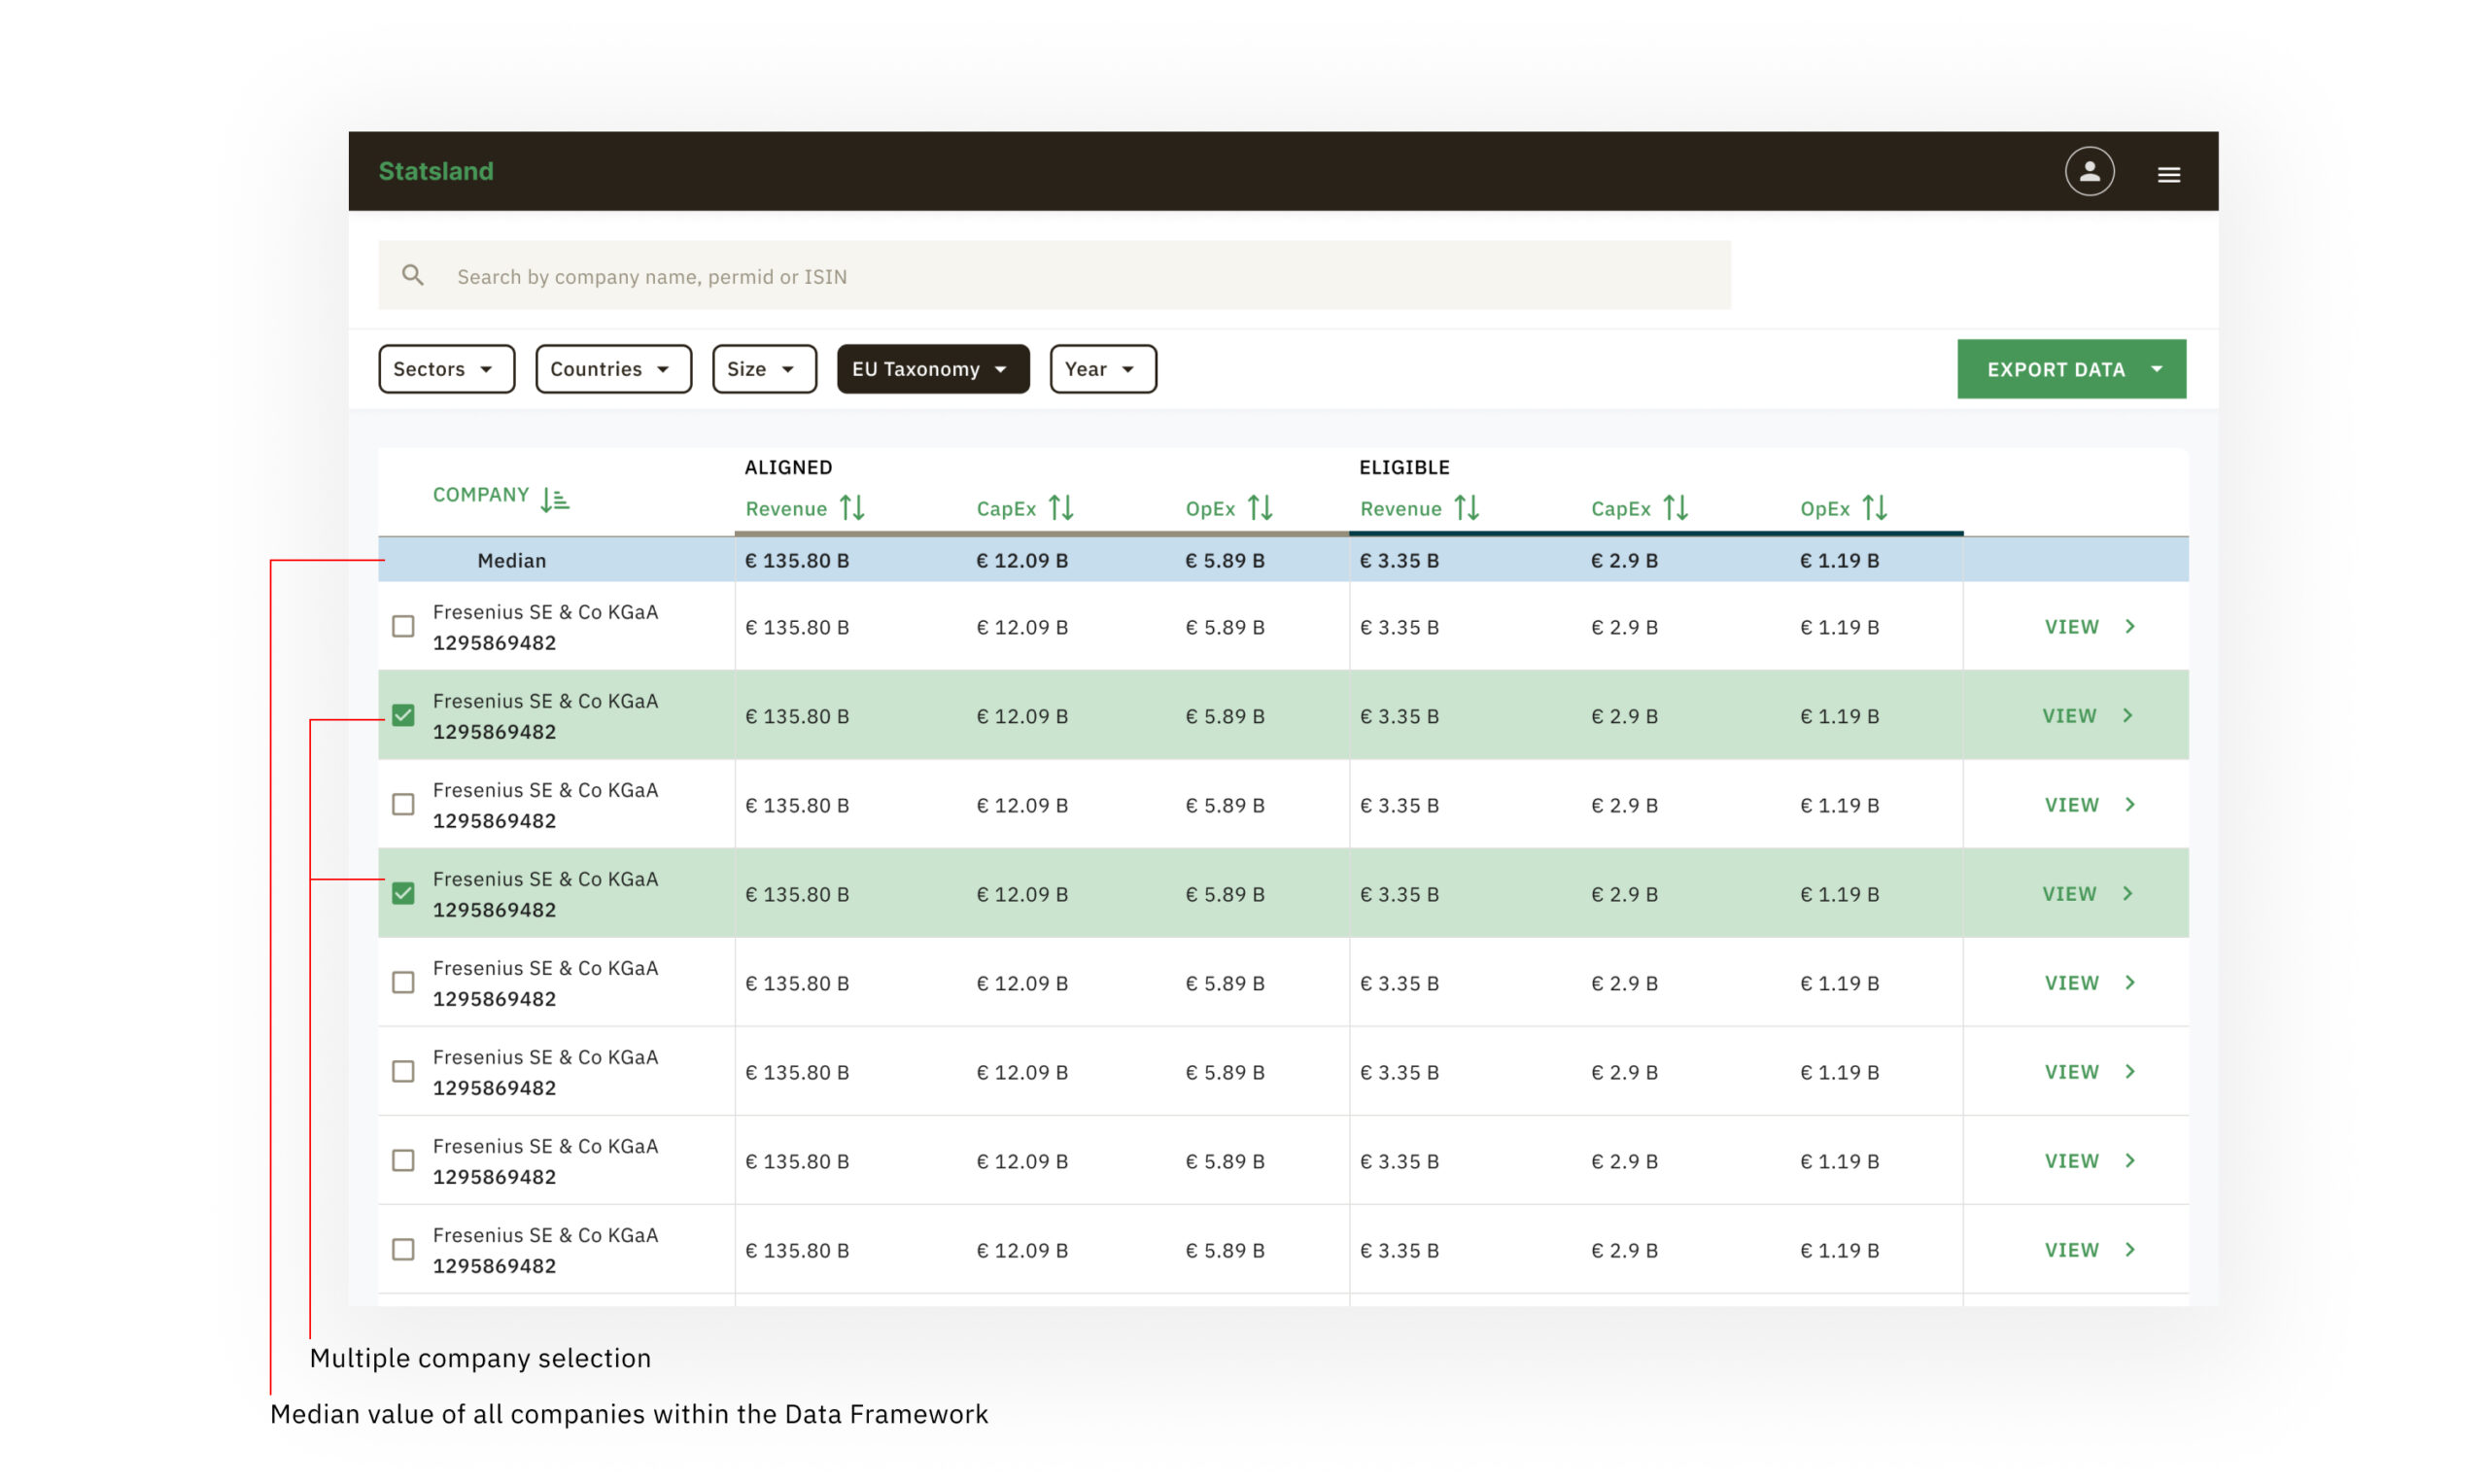
Median value of all the companies data showing the top and selecting mulitple companies to export their data.
Inclusion of SME data as a tab.
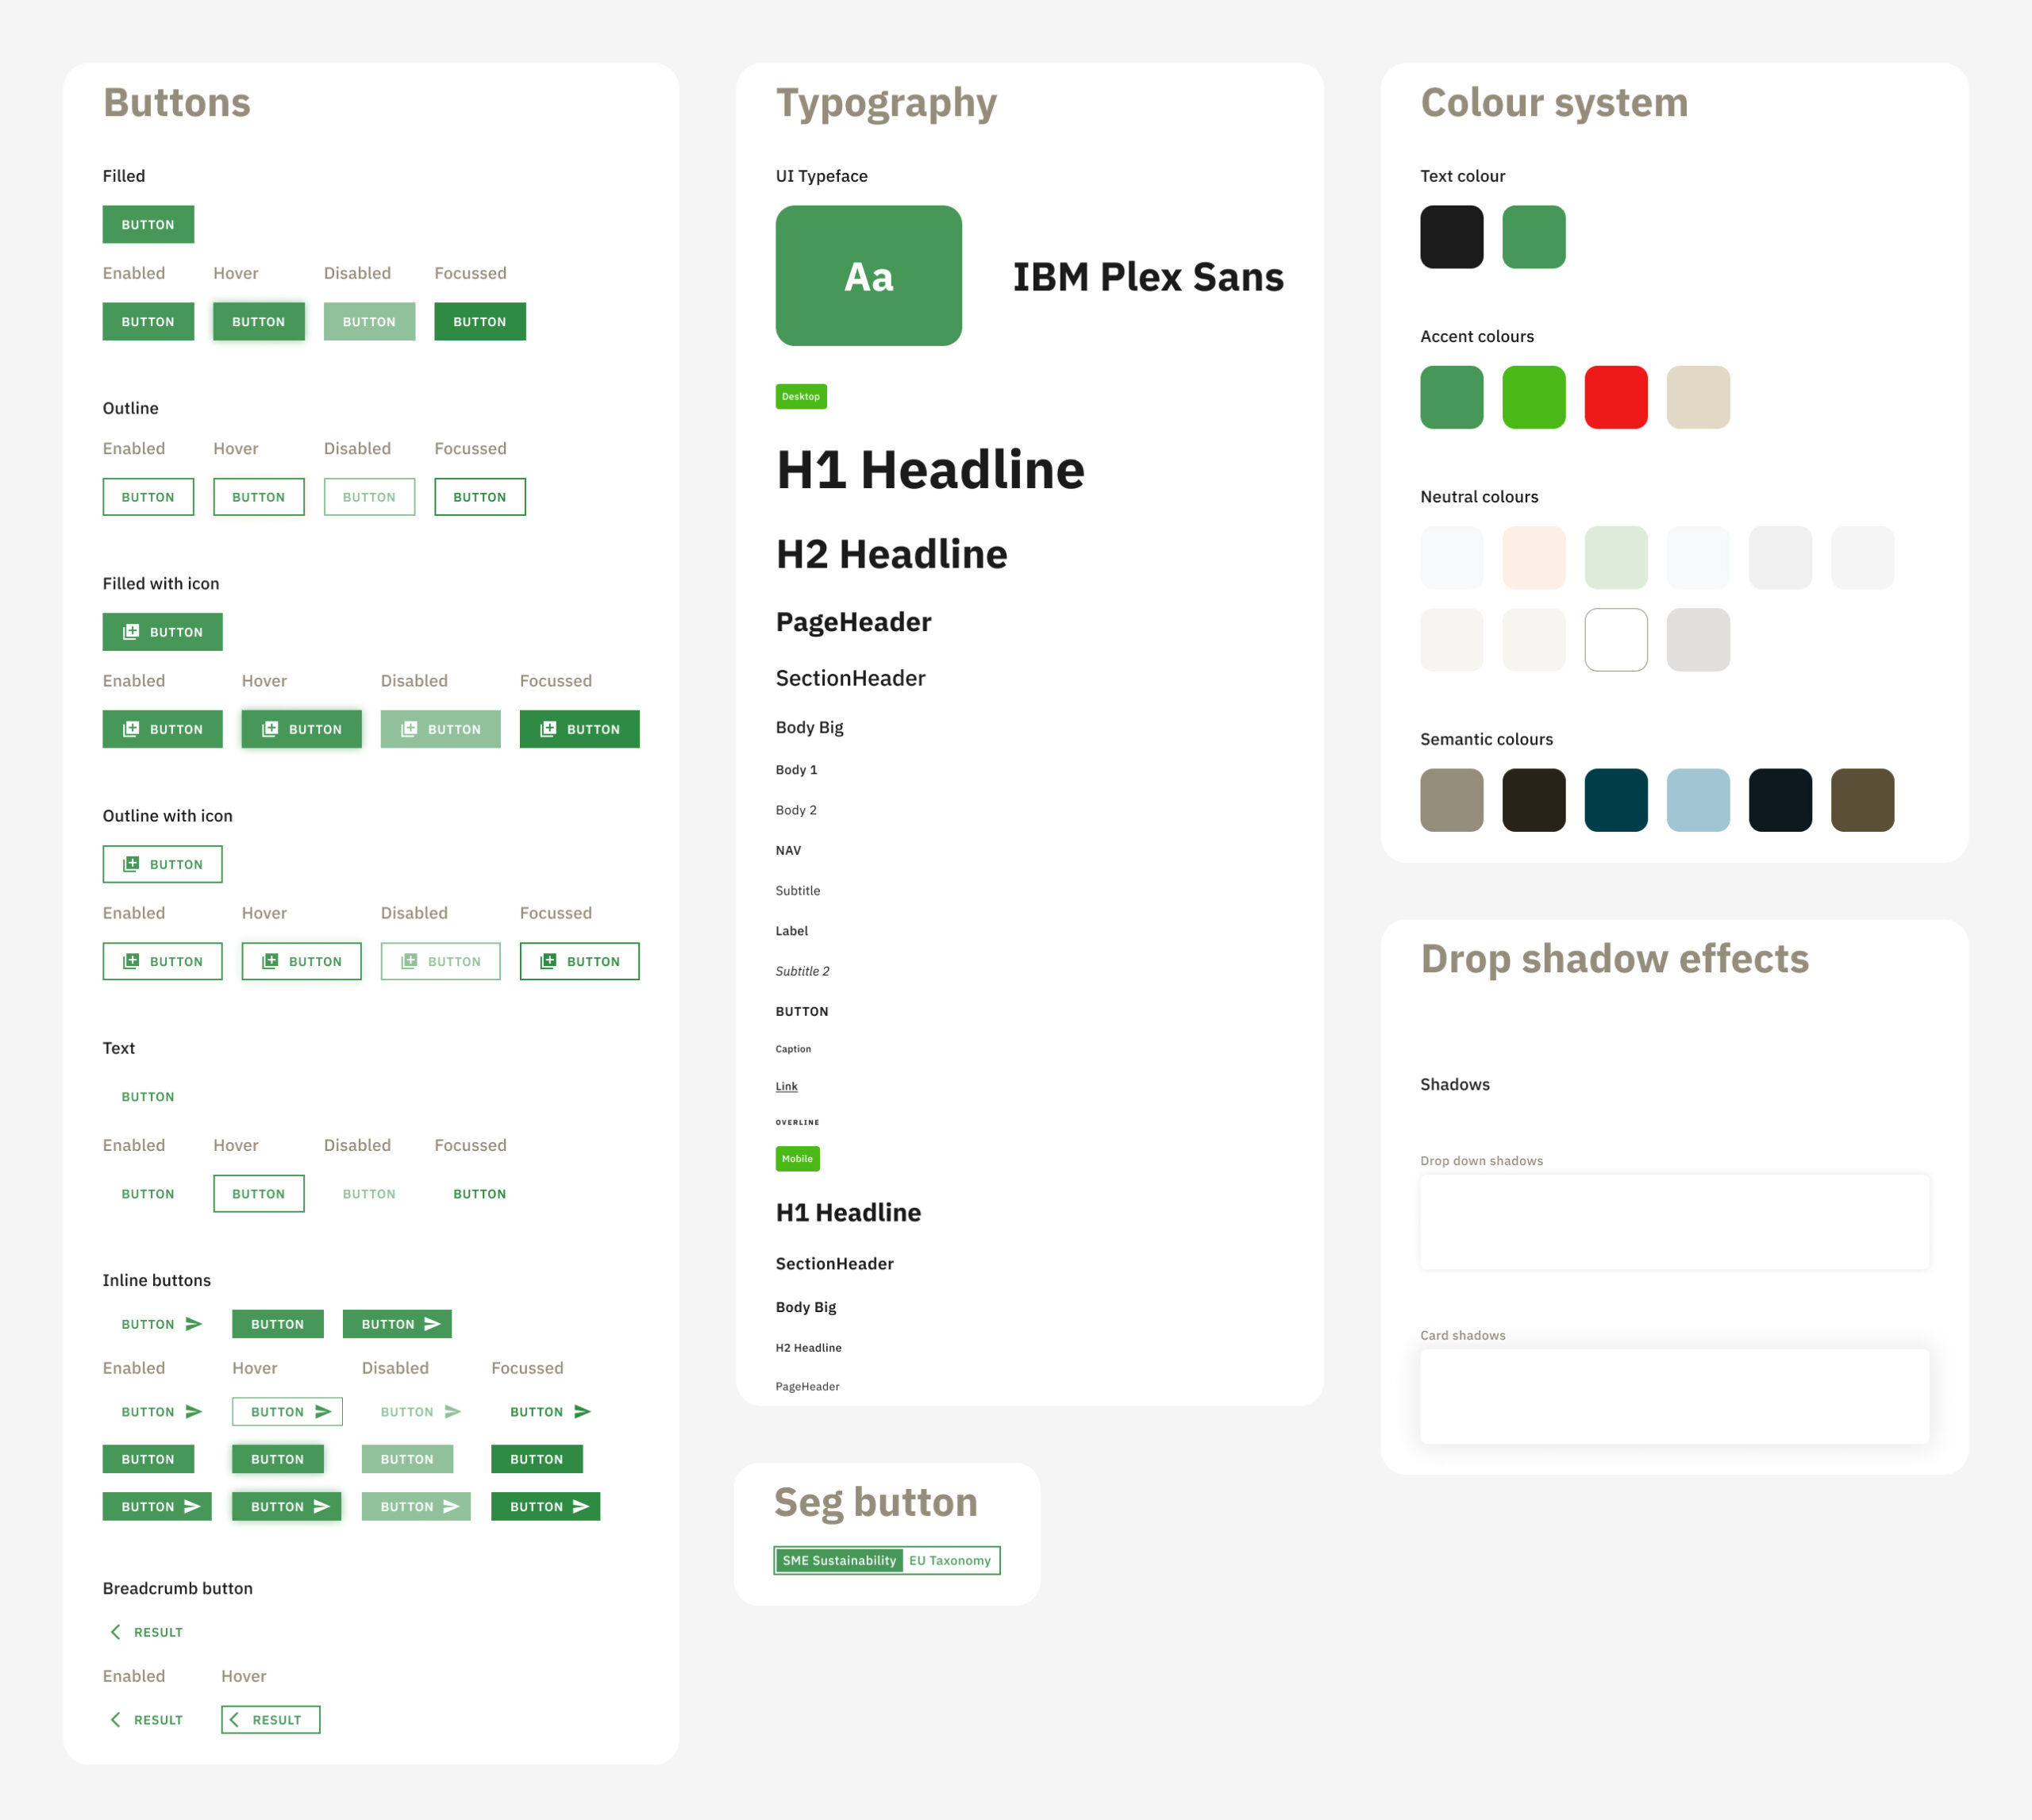
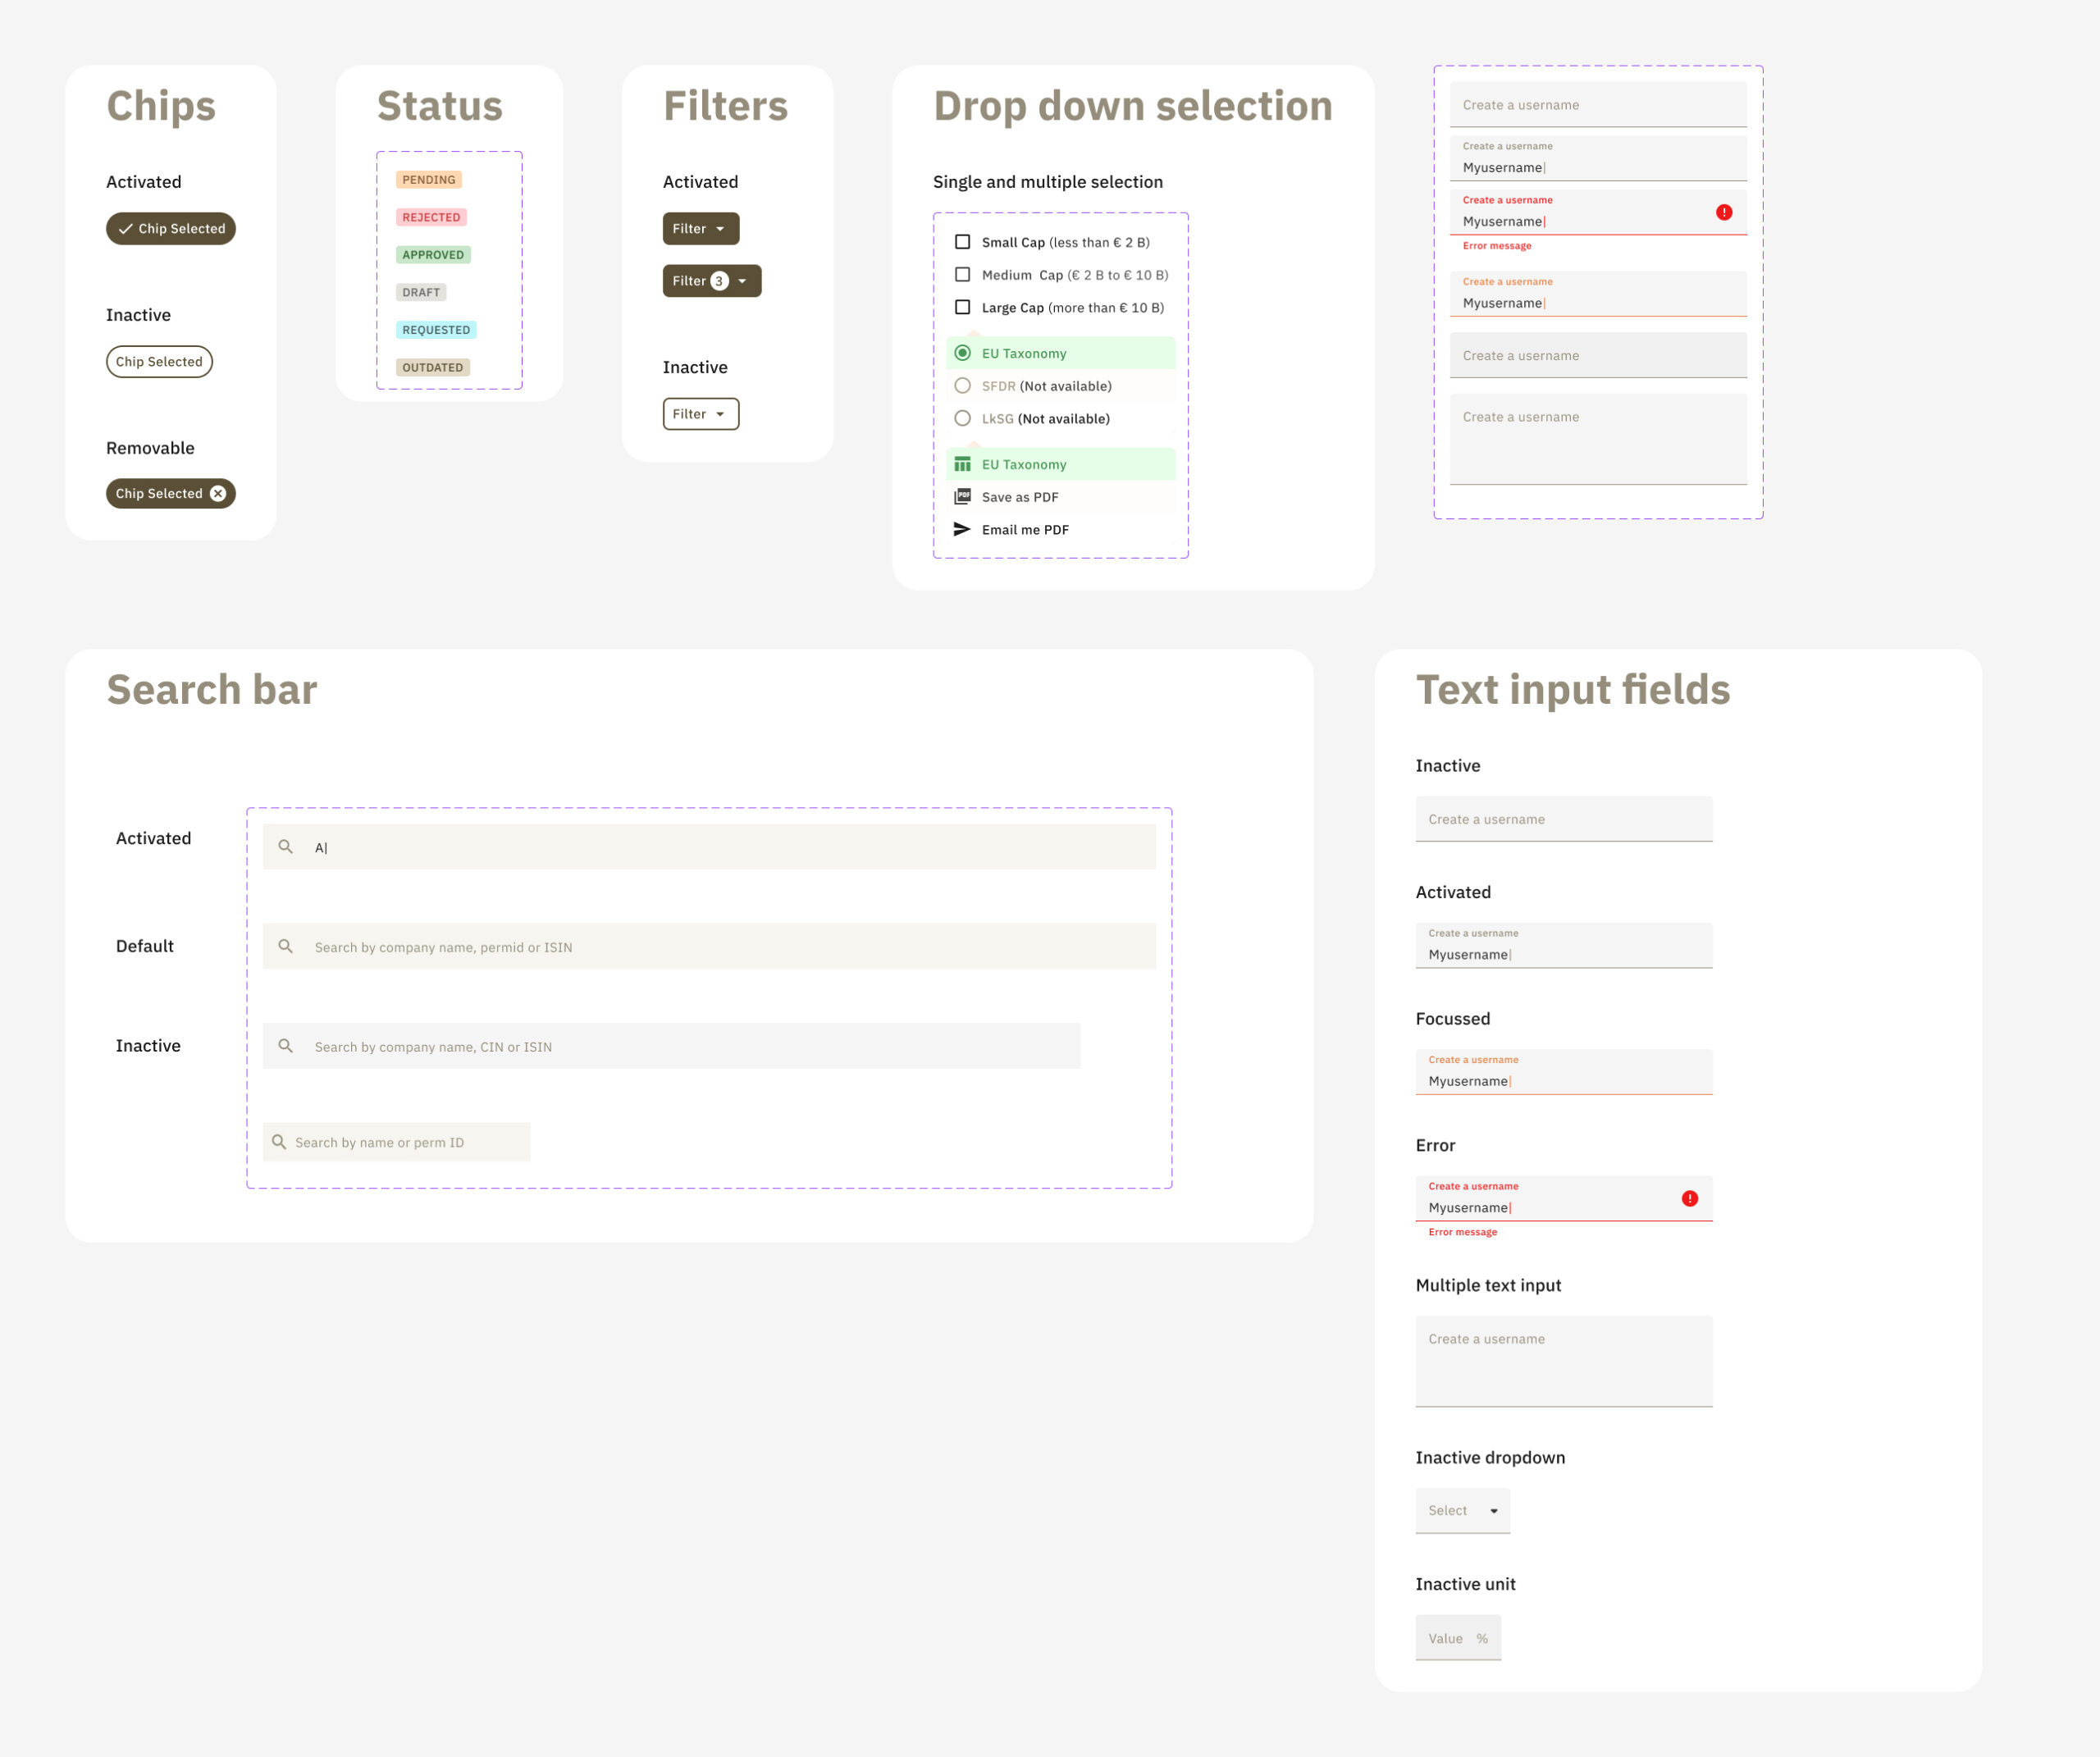
The design system
With the scaling workflows, it was important that the design library had consistent behaviour and visual design.
The development process
We constantly worked with the developers for smooth hand-offs and create a scrum methodology for development-ready design files. I'd leave comments in the development files for the developers explaining the interactions and behaviours. Furthermore, I’d audit the platform and check for consistency of implementation with the design files. We would take a screenshot, add the comments and also keep the associated design file for their reference. We would do this after communicating over our weekly call.
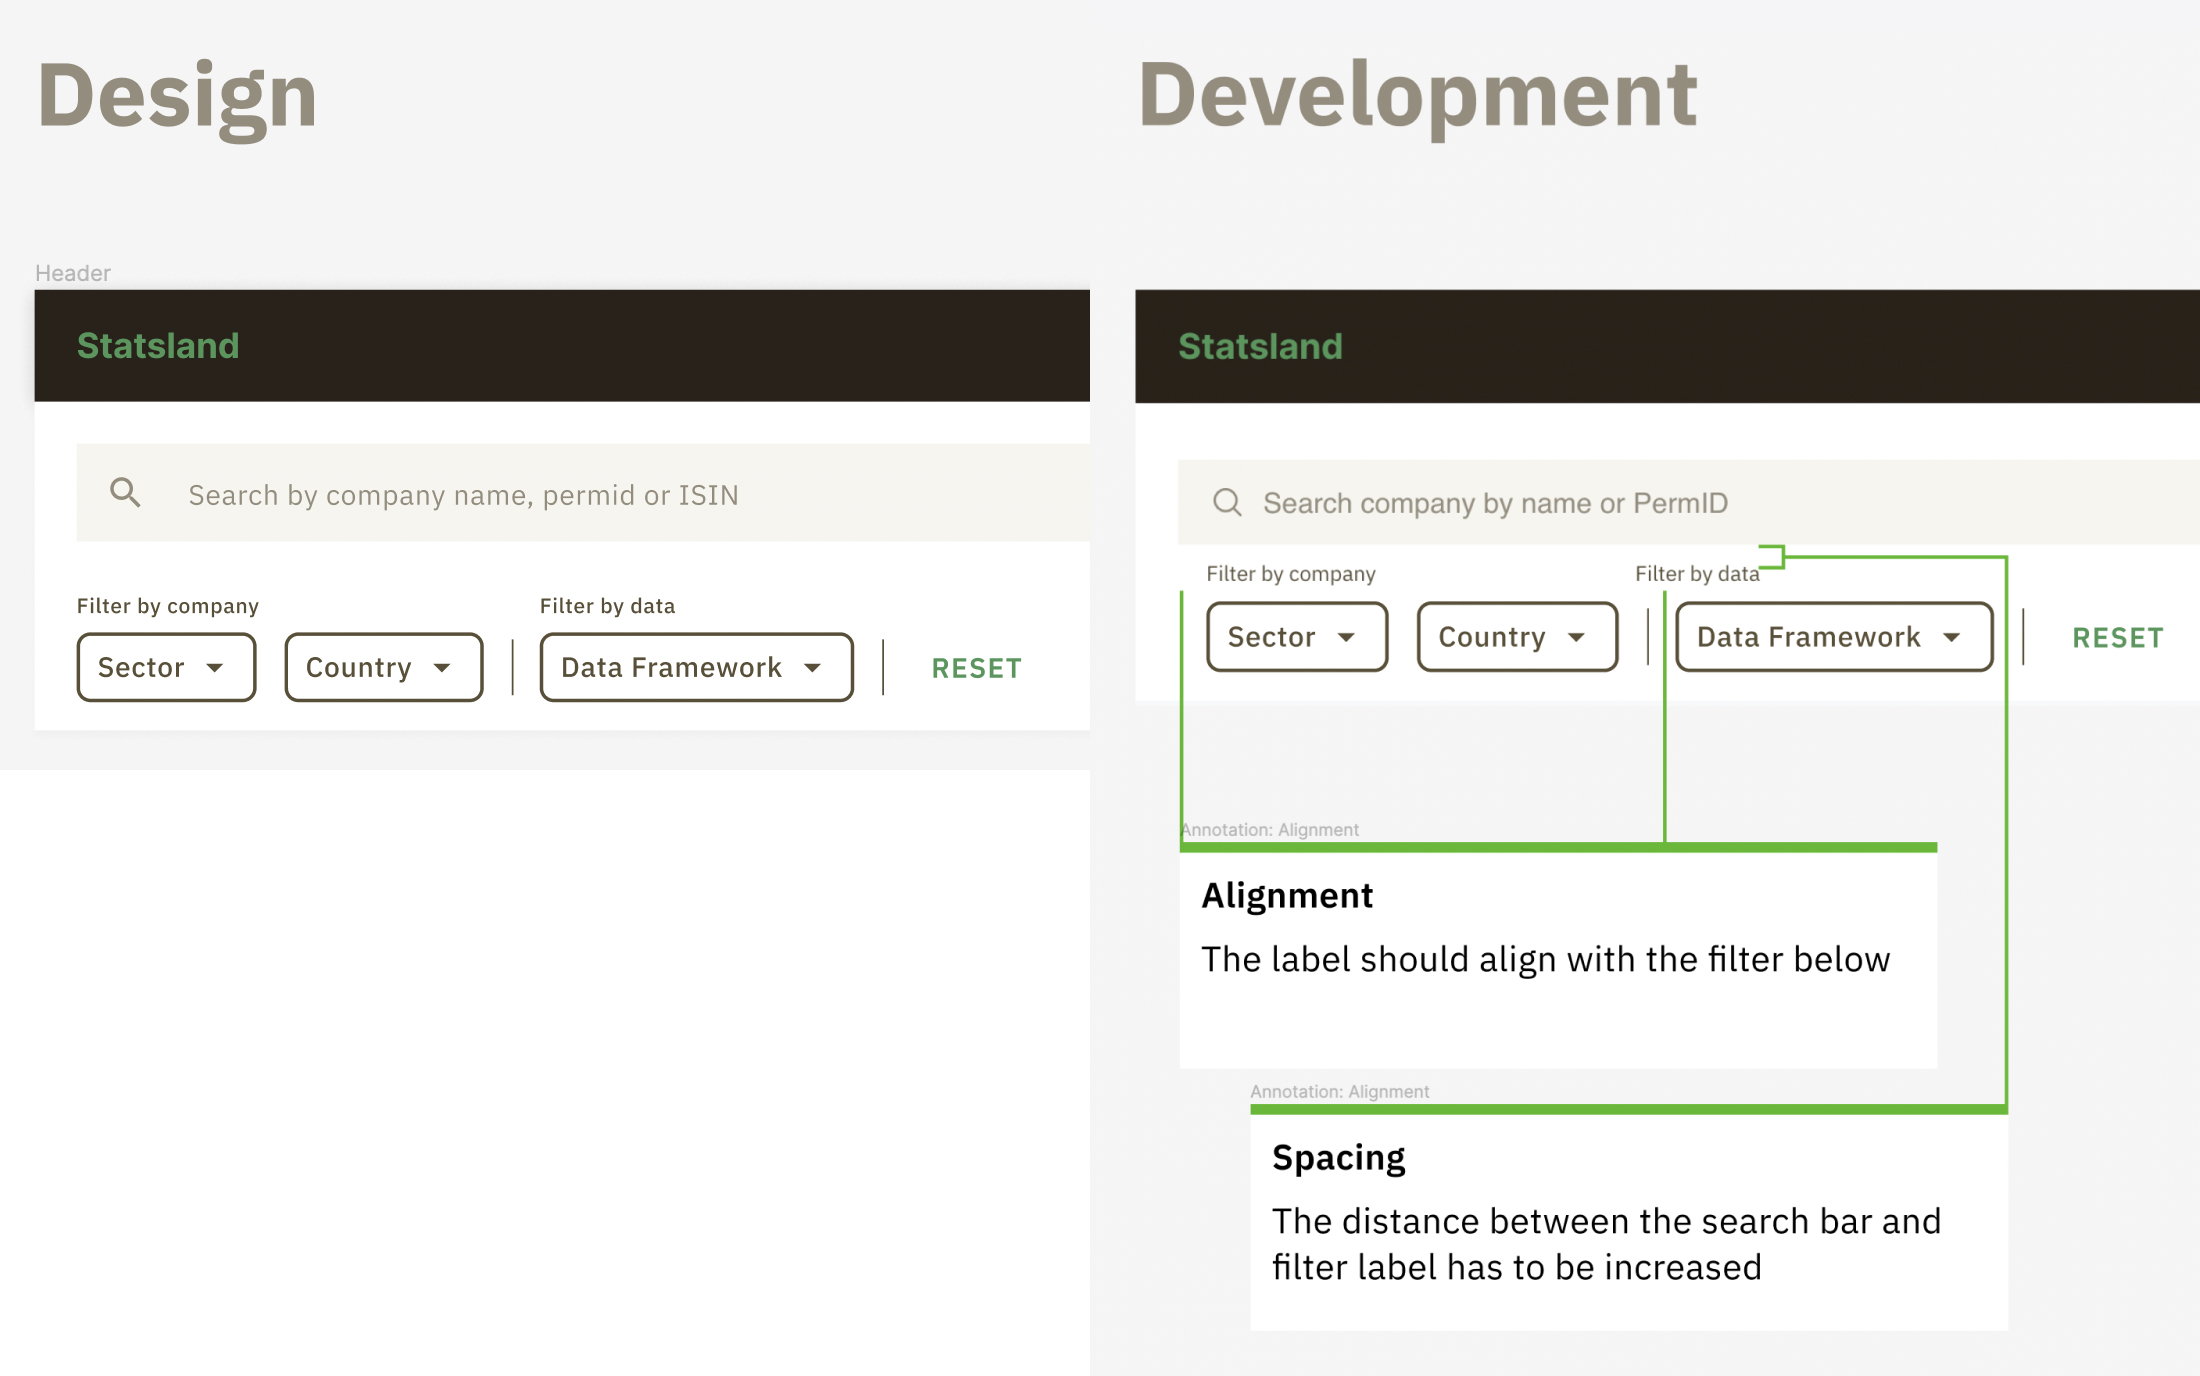
Screenshot with comparions for developers to make the necessary changes.
I left comments in the development files for the developers explaining the interactions and behaviours.
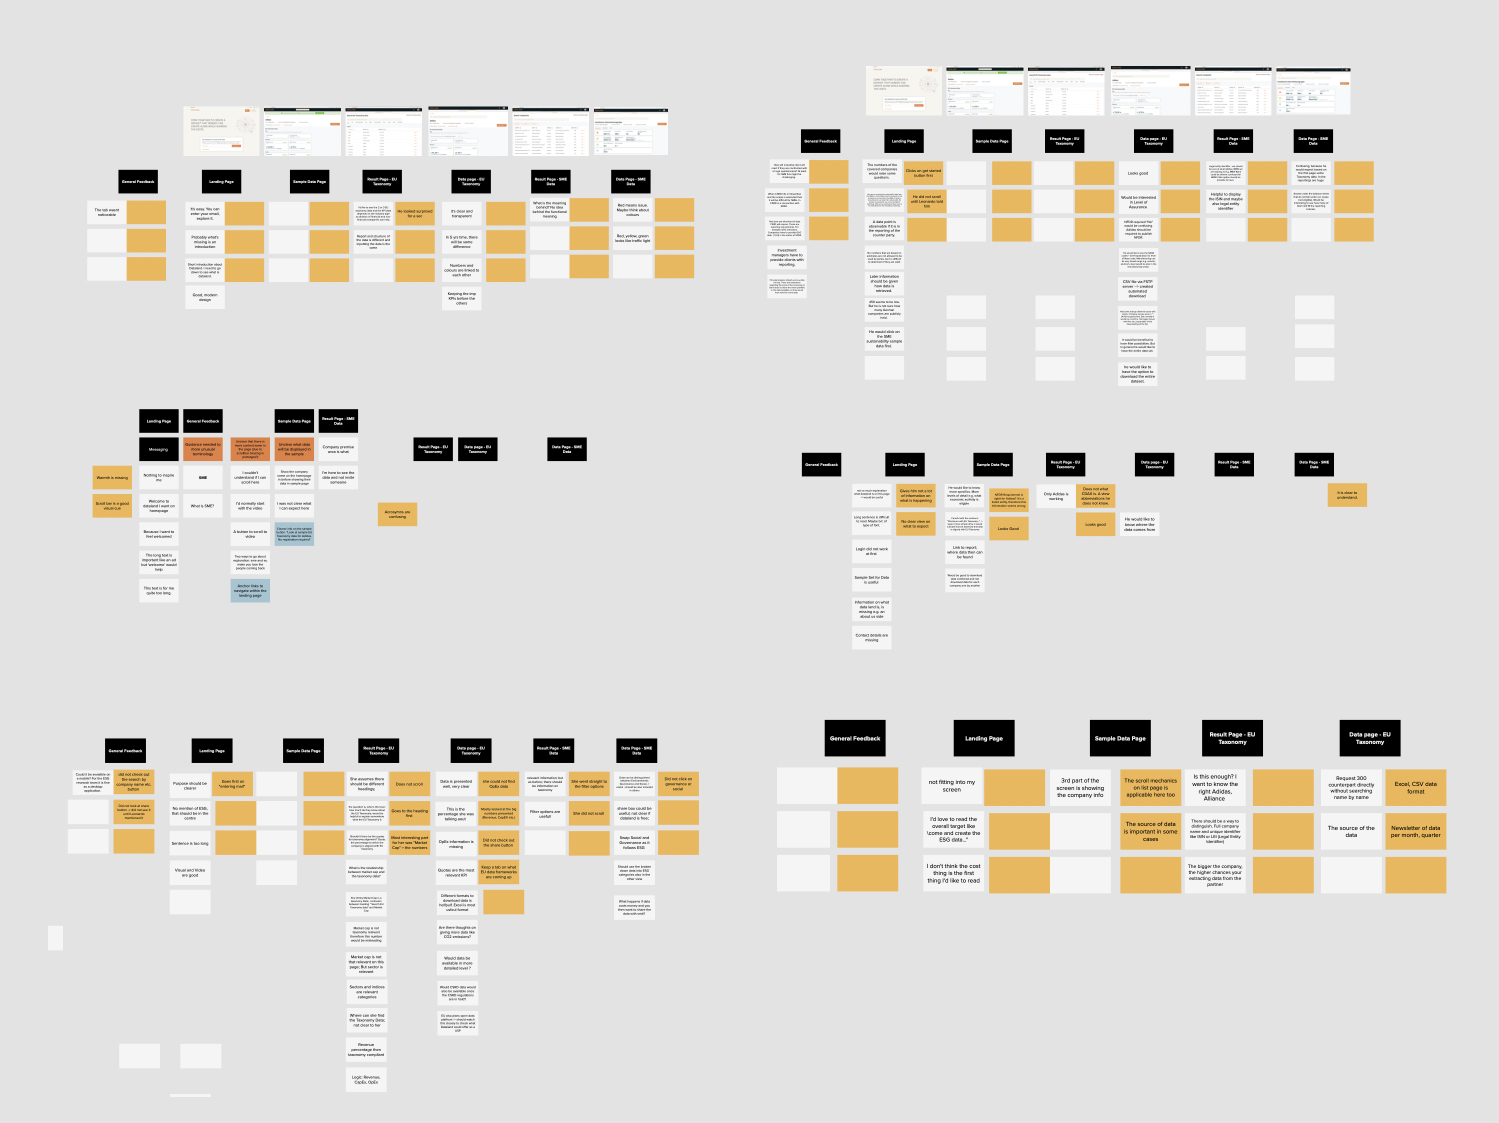
The habit of constant testing
We were always on a lookout for users to test our design concepts. We would later synthesise the findings to incorporate them as feedback and add them as agendas to discuss with the internal stakeholders.
Due to sensitive information, the larger size image cannot be shared.
My learnings
- While dealing with new topics, one has to ready for any change and at any time. There are going to many unknown but one has to be okay going with the hypothesis with limited evidence. The information is dynamic and scarce and one cannot be complacent with what one has design/developed. The new information always takes precedence.
- Putting an order in the design process and communicating that to all the stakeholders helps them understand the timeline for design delivery better. Design processes should be like an open book which is open for others to take a look at. This makes the team members get onboard with design decisions/choices and also fosters a good habit of documentation that helps to come back to the drawing board if any concept needs to be reworked.
More Projects
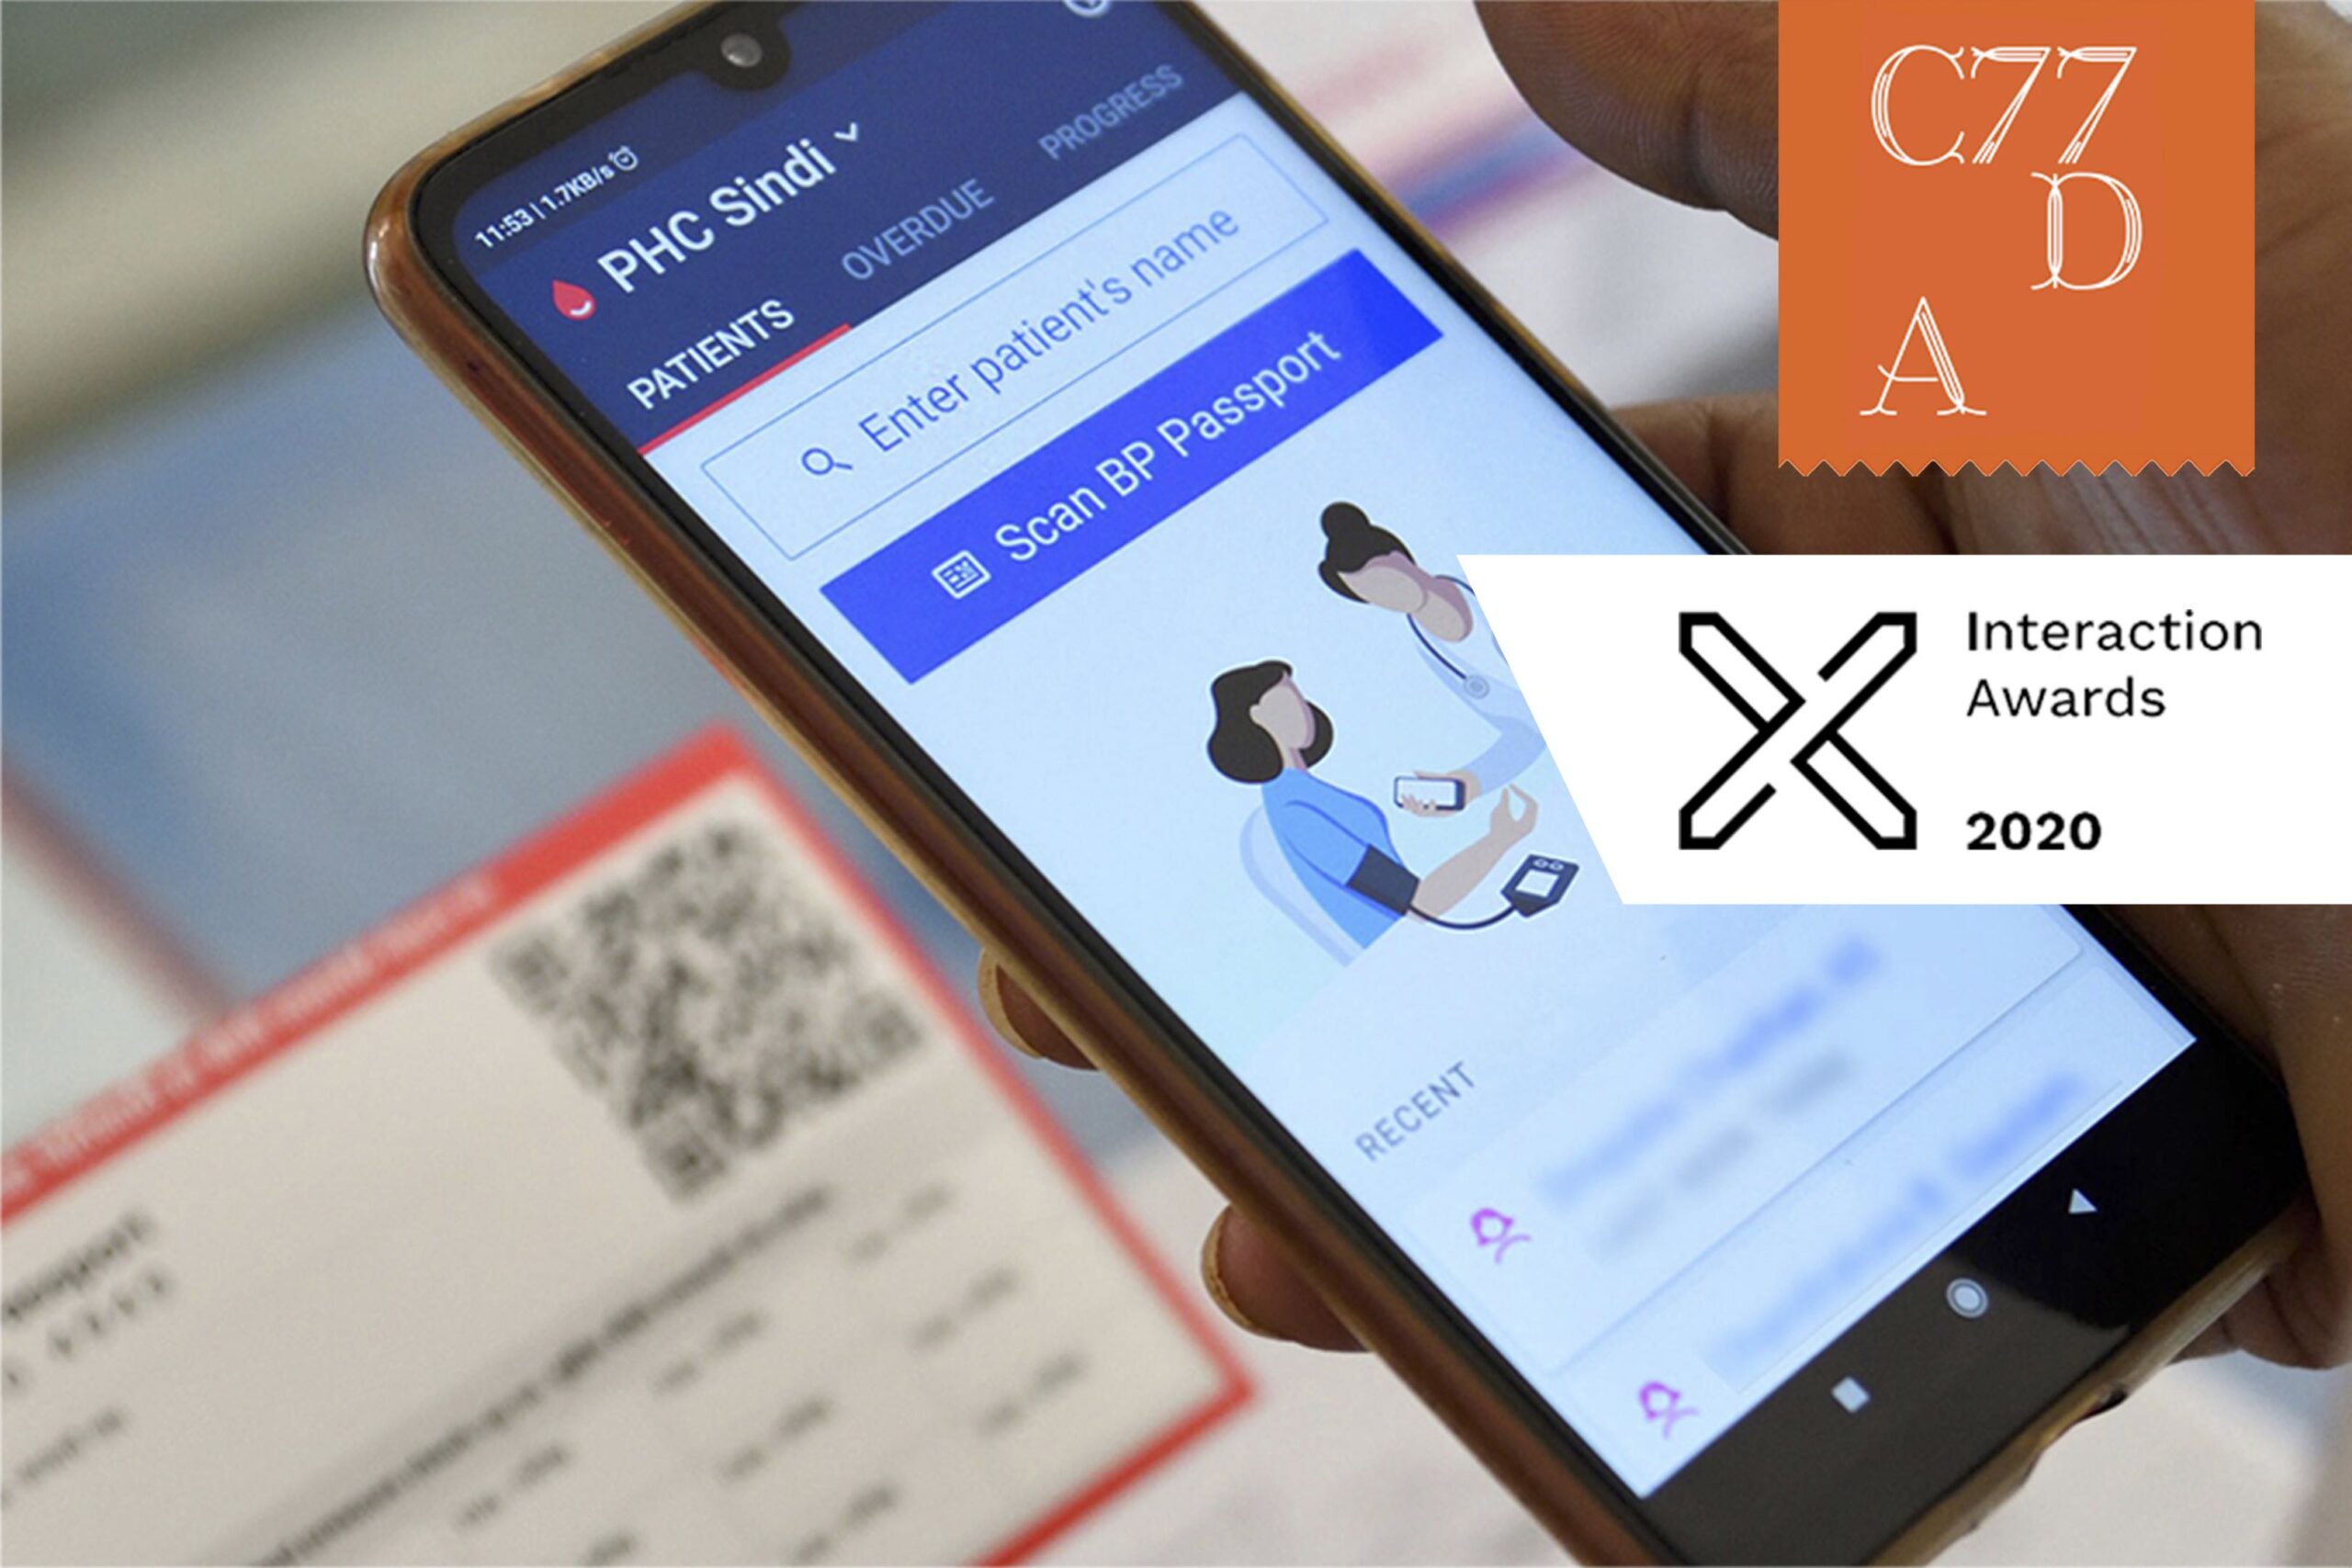
SimpleDesigned onboarding experience of healthcare workers.

ZonderHelped clinicians reduce wound treatment time from 2 hrs to 15 mins.
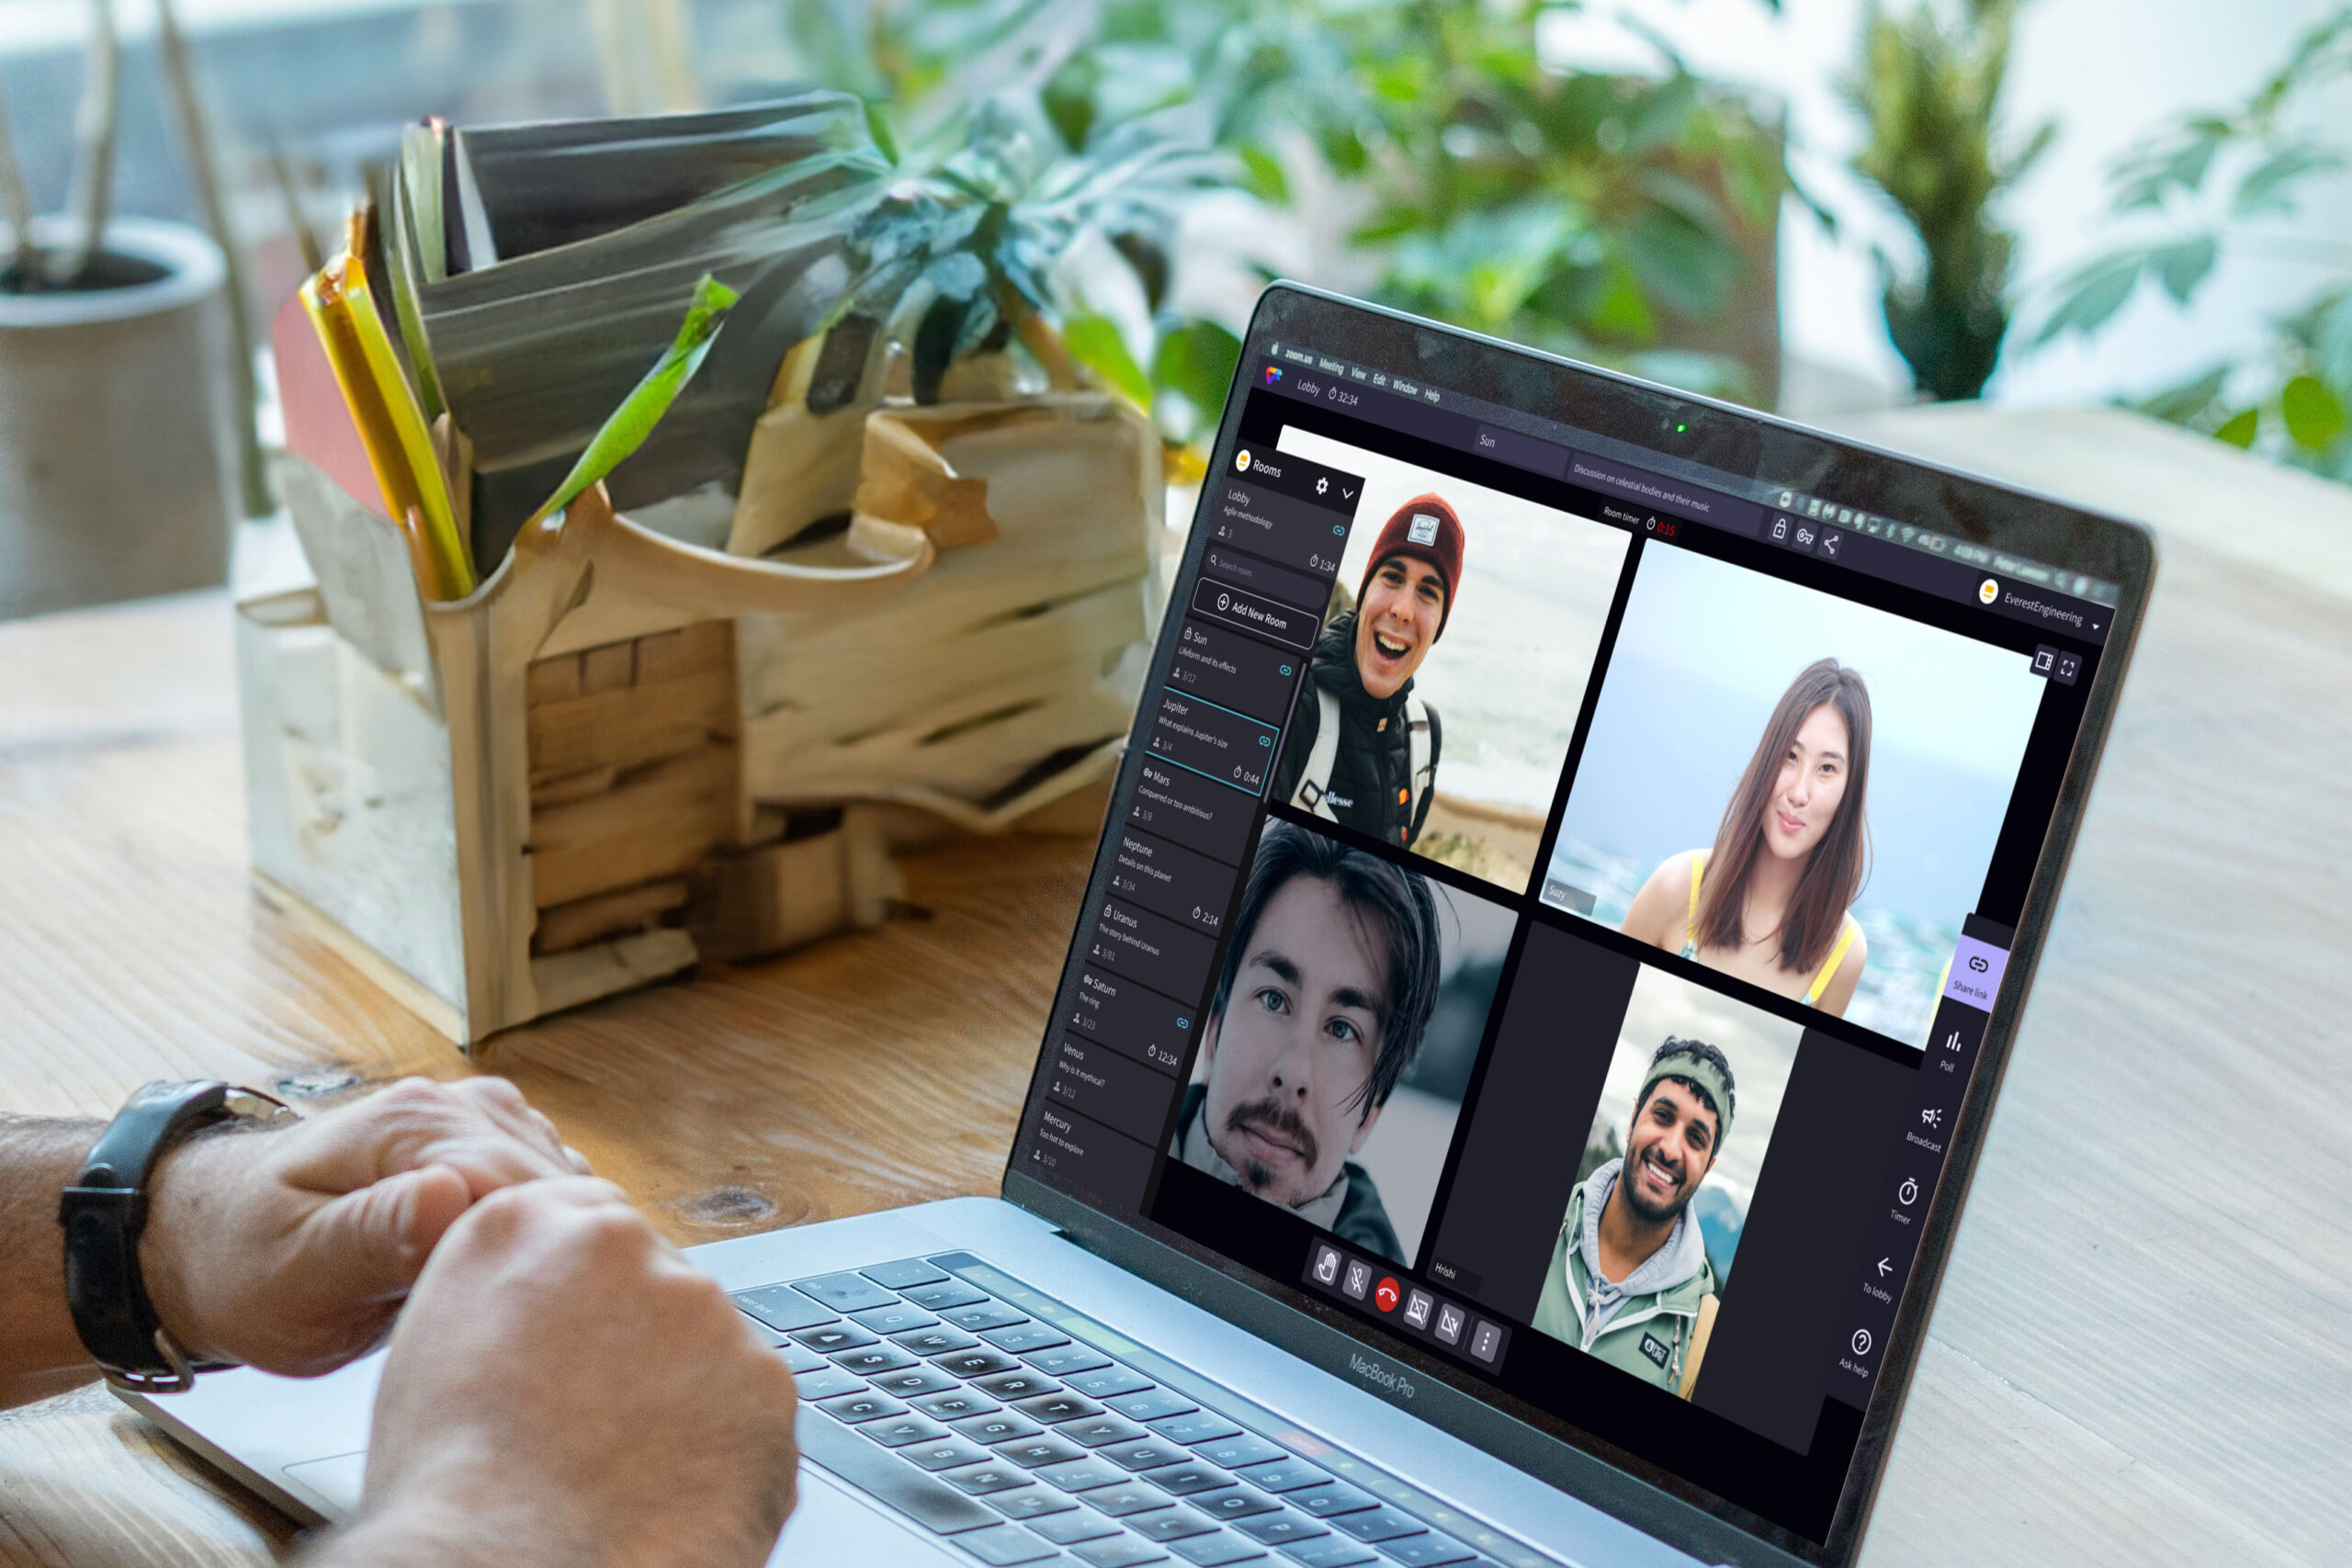
Video FacilitatorRe-designed the platform to support facilitation for large scale conferences.

Connected Health PlatformProvided clarity to stakeholders through prototyping.

NidraExperimental tool to provide relief to sleep deprived people.